
الوصف
*ساعات الافتتاح ستكون مختلفة بين فئات الأصول
*القيم الزمنية الافتراضية لـ NQ/ES/YM (العقود الآجلة)
*يجب أن تكون القيمة الزمنية بتوقيت شرق الولايات المتحدة (EST)
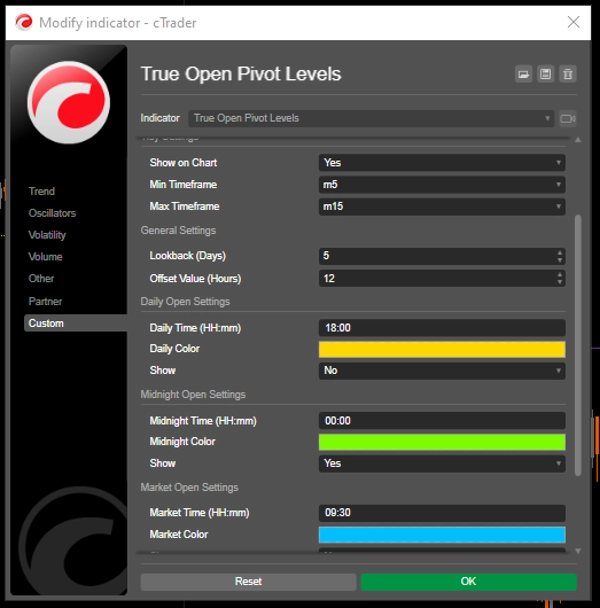
الميزات الرئيسية:
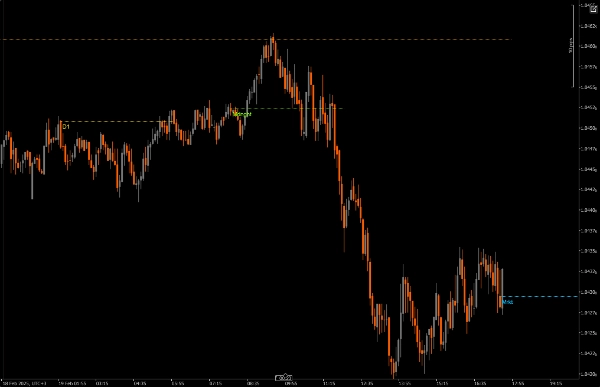
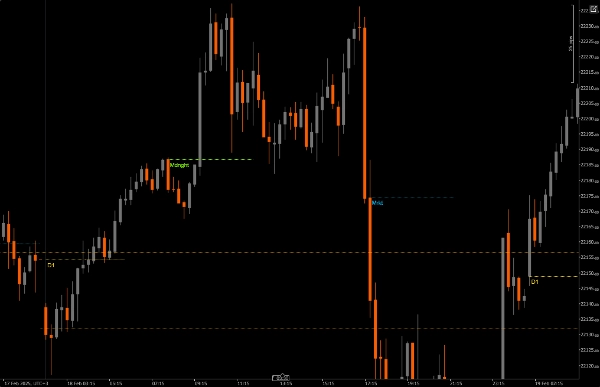
مستويات الأسعار المعتمدة على الوقت
يرسم خطوط سعر الافتتاح عند أوقات السوق الرئيسية
جميع الأوقات متزامنة مع توقيت شرق الولايات المتحدة (EST)
كل فترة زمنية ملونة لسهولة التعرف عليها
3 علامات جلسة قابلة للتخصيص:
الافتتاح اليومي (12:00 صباحًا بتوقيت EST) - افتراضي ذهبي
افتتاح منتصف الليل (4:00 صباحًا بتوقيت EST) - افتراضي أخضر
افتتاح السوق (9:30 صباحًا بتوقيت EST) - افتراضي أزرق
يمكن تشغيل/إيقاف كل جلسة بشكل مستقل
التخصيص البصري:
سمك الخط قابل للتعديل
أنماط خطوط متعددة (صلب، منقط، متقطع)
ألوان قابلة للتخصيص لكل جلسة
تسميات زمنية اختيارية تظهر أوقات EST
إزاحة الخط قابلة للضبط حتى 48 ساعة
دعم إطار زمني مرن:
تعيين الحد الأدنى والأقصى للأطر الزمنية للعرض
يمنع ازدحام الرسم البياني في الأطر الزمنية غير المناسبة
محسن للأطر الزمنية M5-M15
إعدادات الوقت:
جميع الأوقات بتوقيت EST
تخصيص أوقات الجلسات لتتناسب مع استراتيجية التداول الخاصة بك
تعديل مدة الخط بناءً على احتياجات التحليل الخاصة بك
الإعدادات البصرية:
تعديل سمك الخط للرؤية الواضحة
اختيار نمط الخط بناءً على وضوح الرسم البياني
تمكين/تعطيل التسميات حسب الحاجة
تخصيص الألوان لتتناسب مع موضوع الرسم البياني الخاص بك
الإعدادات العامة:
تحديد الحد الأدنى/الأقصى للأطر الزمنية
تعديل مدة الخط للتحليل الممتد
أفضل الممارسات:
ابدأ بالإعدادات الافتراضية وقم بالتعديل حسب احتياجاتك
استخدم ألوان مختلفة لكل جلسة لتمييز واضح
فكر في تقليل مدة الخط في الأطر الزمنية الأقل لمنع الازدحام
قم بتمكين التسميات في البداية لفهم التوقيت، وعطلها إذا أصبح الرسم البياني مزدحمًا جدًا
طابق إعدادات إطار المؤشر مع إطار التداول الخاص بك
هذا المؤشر مفيد بشكل خاص لـ:
المتداولين اليوميين الذين يركزون على الأسواق الأمريكية
المتداولين الذين يحتاجون لتتبع افتتاح الجلسات
الذين يتداولون حول الأحداث السوقية الكبرى
المتداولين الذين يحللون حركة السعر عبر جلسات متعددة
أي شخص يحتاج إلى مرجع بصري واضح لأوقات السوق بتوقيت EST
الملخص
تقييمات العملاء
5 | 100 % | |
4 | 0 % | |
3 | 0 % | |
2 | 0 % | |
1 | 0 % |


