
الوصف
VolumeProfileSuite هو مؤشر متقدم ومرن لملف الحجم لـ cTrader.
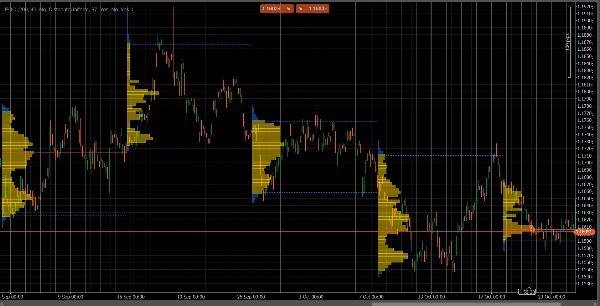
الغرض الأساسي منه هو تحليل توزيع الحجم (أي، أين حدث النشاط التجاري) عند مستويات سعرية مختلفة لتحديد مناطق "القيمة" (حجم مرتفع) و"الرفض" (حجم منخفض). هذا يساعدك في العثور على أهم مستويات الدعم والمقاومة بناءً على نشاط السوق الحقيقي.
الميزة الفريدة له هي أنه يجمع بين وضعين قويين للتحليل في أداة واحدة، يمكن اختيارها عبر Profile Mode المعامل:
FixedRangeالوضع: مثالي للتحليل الكلي. يسمح لك بتحليل كتلة واحدة كبيرة من اختيارك (مثل آخر 1000 شريط أو فترة زمنية محددة، مثلاً "كل الأسبوع الماضي"). إنه مثالي لإيجاد مستويات الدعم/المقاومة الرئيسية طويلة الأجل.Periodicالوضع: مثالي للتحليل الصغير والسلوكي. يرسم تلقائيًا ملفًا جديدًا كل "N" أشرطة (مثلاً، كل 100 شريط). هذا يسمح لك برؤية كيف يتطور POC ومنطقة القيمة مع الوقت ودراسة أنماط السوق المتكررة.- دليل المعاملات (بالإنجليزية)
إليك الدليل المحدث لمؤشر VolumeProfileSuite الموحد الجديد. هذا الدليل مهم لأنه يشرح المعاملات التي يجب استخدامها (والتي يجب تجاهلها) بناءً على الوضع المختار.
المجموعة 1: الوضع الرئيسي
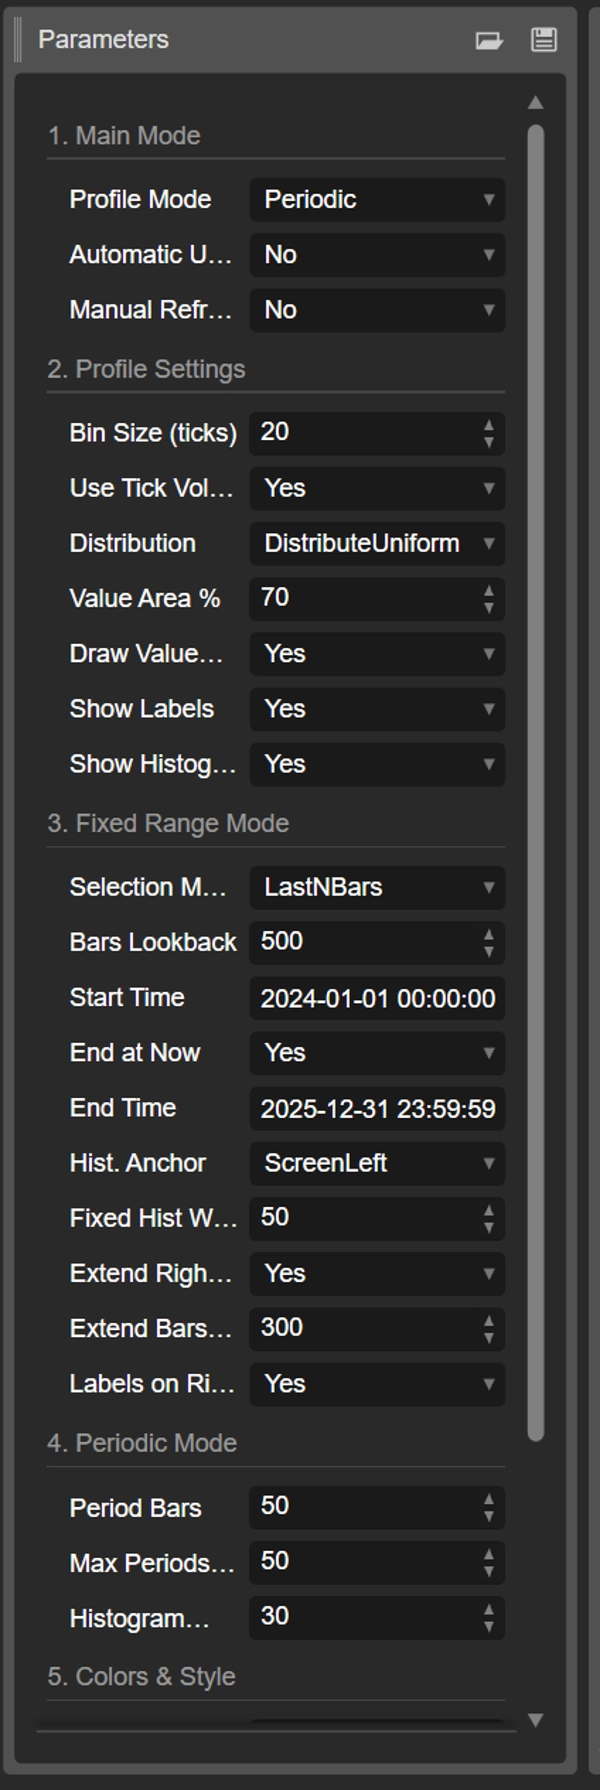
- وضع الملف: هذا هو المعامل الأهم ويعمل كمفتاح رئيسي.
-
FixedRange: يُفعّل وضع "الكتلة الواحدة". سيحلل المؤشر فترة واحدة فقط محددة من قبلك (باستخدام الإعدادات في المجموعة 3).Periodic: يُفعّل الوضع "الدوري". سيقوم المؤشر تلقائيًا بتحليل الرسم البياني بأكمله على شكل كتل (استنادًا إلى الإعدادات في المجموعة 4).
مهم: عند استخدام وضع
FixedRange، يجب عليك تجاهل جميع المعاملات في "المجموعة 4: الوضع الدوري". وعند استخدام وضعPeriodic، يجب عليك تجاهل جميع المعاملات في "المجموعة 3: وضع النطاق الثابت".
المجموعة 2: إعدادات الملف
هذه المعاملات مشتركة وتنطبق على كلا الوضعين (FixedRange و Periodic).
- حجم الخانة (ticks): يتحكم في "دقة" الملف عموديًا. قيمة منخفضة (مثلاً
1) تخلق صفوف سعرية رفيعة كثيرة (تفصيلية جدًا). قيمة عالية (مثلاً10) تجمع الأسعار في صفوف أكثر سمكًا (أقل تفصيلاً، "أنعم"). - استخدام حجم التيك: إذا كانت
true(موصى به)، يستخدم الملف حجم التيك الحقيقي، وهو دقيق جدًا. إذا كانتfalse، فإنه ببساطة يعد "1" لكل شريط. - التوزيع: يحدد كيف يتم توزيع حجم الشريط.
-
DistributeUniform(افتراضي): "ينشر" حجم الشريط عبر جميع مستويات السعر التي لمسها، من أدنى سعر إلى أعلى سعر.CloseOnly: يخصص كل حجم الشريط فقط لسعر الإغلاق الخاص به.
- نسبة منطقة القيمة %: يحدد نسبة الحجم التي تشكل "منطقة القيمة" (منطقة أعلى نشاط تداول). القيمة
70(70%) هي المعيار السوقي. - رسم منطقة القيمة (VAH/VAL): إذا كانت
true، يرسم الخطوط الأفقية لـ قمة منطقة القيمة (VAH) و قاع منطقة القيمة (VAL). - عرض التسميات: إذا كانت
true، يعرض تسميات نصية ("POC"، "VAH"، "VAL"). (كن حذرًا: في وضعPeriodic، قد يزدحم الرسم البياني). - عرض المدرج التكراري: إذا كانت
true، يرسم المدرج التكراري للحجم (الأشرطة الأفقية).
المجموعة 3: وضع النطاق الثابت
⚠️ استخدم هذه المعاملات فقط إذا تم تعيين "وضع الملف" إلى FixedRange.
- وضع الاختيار: يختار كيفية تعريف الكتلة الواحدة الخاصة بك.
-
DateRange: يستخدم تاريخ/وقت بداية ونهاية محدد.LastNBars: يستخدم آخر N أشرطة.
- عدد الأشرطة للرجوع للخلف: (لـ
LastNBarsفقط) عدد الأشرطة التي يتم تحليلها للخلف (مثلاً،500). - وقت البدء / الانتهاء الآن / وقت الانتهاء: (لـ
DateRangeفقط) تحديد بداية ونهاية الفاصل الزمني الخاص بك. - مرساة المدرج التكراري: (لـ
FixedRangeفقط) يحدد مكان تثبيت المدرج التكراري. -
DateRangeStart: في بداية فاصل الوقت الخاص بك (قد يكون خارج الشاشة).ScreenLeft: إلى الحافة اليسرى للنافذة المرئية.ScreenRight: إلى الحافة اليمنى للنافذة المرئية (في المساحة الفارغة).
- عرض المدرج الثابت (أشرطة): عرض المدرج التكراري (بالأشرطة) لوضع
FixedRange. - تمديد إلى اليمين فقط: إذا كانت
true، يتم تمديد خطوط POC/VAH/VAL إلى المستقبل. - تمديد الأشرطة: (فقط إذا كانت
Extend Right Onlyهيtrue) عدد الأشرطة التي يتم تمديد الخطوط بها. - التسميات على اليمين: إذا كانت
true، يضع تسميات الأسعار في نهاية الخطوط الممتدة على اليمين.
المجموعة 4: الوضع الدوري
⚠️ استخدم هذه المعاملات فقط إذا تم تعيين "وضع الملف" إلى Periodic.
- أشرطة الفترة: هذا هو المعامل الرئيسي لهذا الوضع. يحدد عدد الأشرطة التي يتم تضمينها في كل كتلة دورية (مثلاً،
100). - الحد الأقصى للفترات للرسم: 🌟 معامل الأمان! هذا يحد من عدد الملفات الدورية المرسومة لمنع تعطل cTrader. القيمة
50تعني أنه سيرسم فقط أحدث 50 ملفًا، حتى لو كان التاريخ يحتوي على أكثر. لا تضبط هذا الرقم عاليًا جدًا (مثلاً، أكثر من 200) وإلا قد يتجمد cTrader! - عرض المدرج التكراري (أشرطة): عرض المدرج التكراري (بالأشرطة) لكل كتلة دورية.
المجموعة 5: الألوان والأسلوب
هذه المعاملات مشتركة وتنطبق على كلا الوضعين.
- لون POC: لون خط نقطة التحكم.
- لون VA: لون خطوط VAH و VAL.
- سمك الخط: سمك خطوط POC و VAH و VAL.
- لون المدرج التكراري لمنطقة القيمة: لون أشرطة المدرج التكراري داخل منطقة القيمة (افتراضي: أصفر).
- لون المدرج التكراري خارج المنطقة: لون أشرطة المدرج التكراري خارج منطقة القيمة (افتراضي: أزرق).
- نسبة شفافية المدرج التكراري %: شفافية (عتامة) المدرج التكراري بالكامل.
الملخص
The indicator offers two main analysis modes selectable via the Profile Mode parameter:
1. FixedRange Mode: Analyzes a single user-defined interval, such as a specific date range or the last N bars, suitable for macro-level, long-term support and resistance identification.
2. Periodic Mode: Automatically segments the chart into consecutive blocks of N bars, drawing a new profile for each. This mode supports micro-level and behavioral analysis by tracking how the Point of Control (POC) and Value Area evolve over time.
Common configurable settings include bin size (price resolution), volume type (tick volume or bar count), volume distribution method, value area percentage, and visual options such as histogram display and labeling. FixedRange and Periodic modes have distinct parameter groups to tailor their respective analyses.
Color and style options allow customization of POC, Value Area lines, and histogram appearance. The tool supports various markets including Forex, indices, commodities, stocks, and cryptocurrencies, as indicated by its relevant tags.
تقييمات العملاء
5 | 50 % | |
4 | 50 % | |
3 | 0 % | |
2 | 0 % | |
1 | 0 % |


![شعار "[Hamster-Coder] Moving Average MTF"](https://cdn.ctrader.com/image/webp/b11b98b1-194d-4b8e-b00e-d611826ad159_31226)


