الوصف
عرض السوق (قصير)
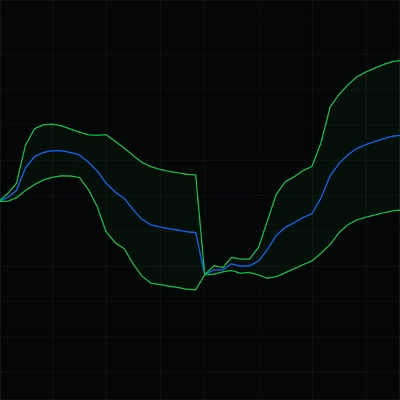
فرق الحجم & CVD — قراءة التدفق العدواني في الوقت الحقيقي. إعادة تعيين مرنة (يوم/أسبوع/شهر)، اختيارية تنعيم EMA، وفرق تراكمي غير معاد رسمه. مثالي لتأكيد الاختراقات واكتشاف التباينات.
فرق الحجم & CVD — مراجعة ودليل المعلمات
الشعار: قياس عدم التوازن بين الشراء/البيع (Delta) وتدفقه التراكمي (CVD) مع إعادة تعيين مرنة. غير معاد رسمه.
نظرة عامة
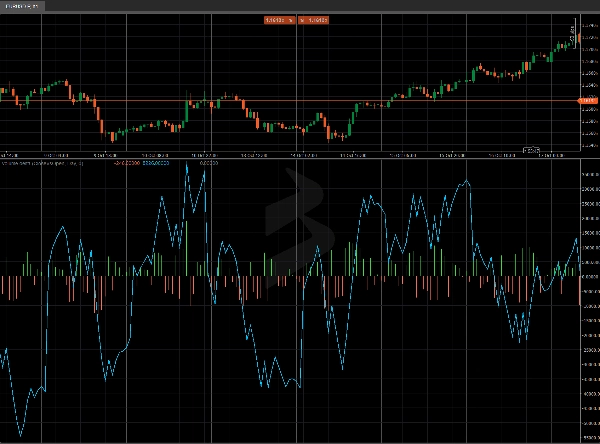
فرق الحجم & CVD لـ cTrader يحسب، لكل شريط، Delta (الشراء العدواني مقابل البيع) و CVD (فرق الحجم التراكمي). يساعدك على قراءة ضغط تدفق الأوامر، تأكيد الاختراقات، واكتشاف التباينات مقابل السعر.
ملاحظة: يستخدم المؤشر TickVolume (المعيار في cTrader) كبديل للحجم.
المعلمات (مفصلة)
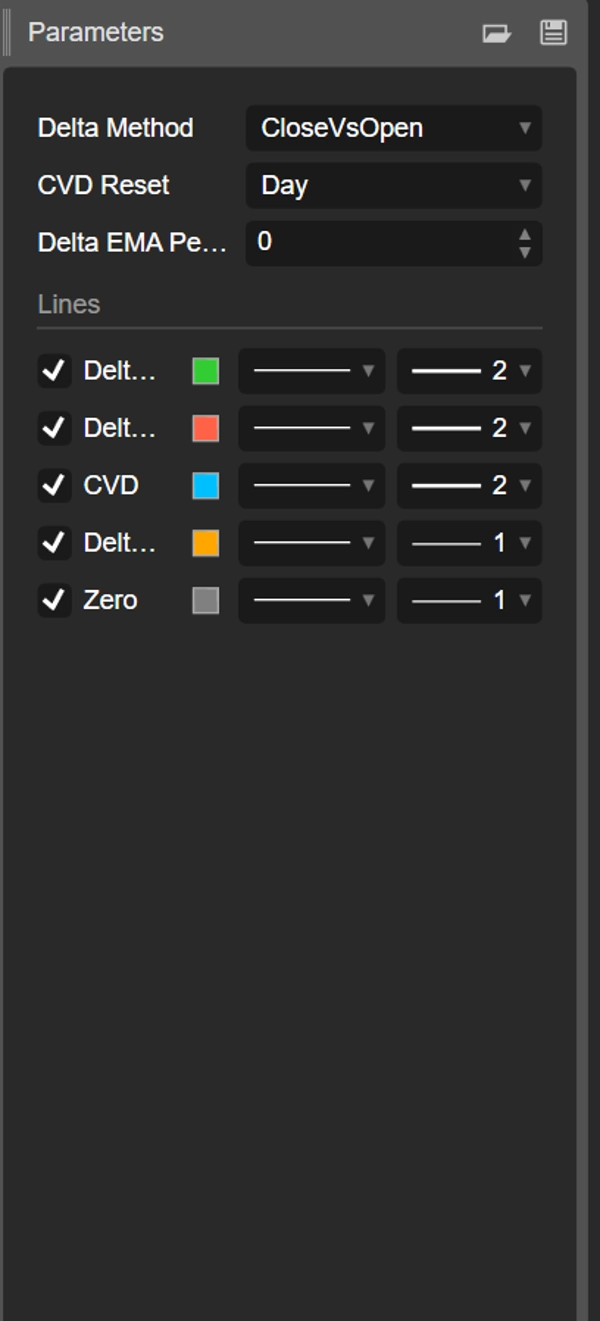
طريقة Delta
اختر كيف يتم تقدير التدفق الاتجاهي للشريط:
- CloseVsPrevClose
Delta = ±TickVolume اعتمادًا على Close[t] مقابل Close[t-1].
الإيجابيات: سريع الاستجابة جدًا؛ ممتاز لتحولات النظام داخل اليوم. - CloseVsOpen
Delta = ±TickVolume اعتمادًا على الإغلاق مقابل الافتتاح للشريط نفسه.
الإيجابيات: يبرز الأشرطة الاتجاهية؛ يقلل من الضوضاء عبر الأشرطة. - مضاعف تدفق المال (MFM)
MFM = ((Close−Low) − (High−Close)) / (High−Low)في [−1, +1]
Delta = MFM × TickVolume
الإيجابيات: وزن داخل الشريط؛ ناعم/قوي عندما تكون النطاقات واسعة.
إعادة تعيين CVD
يتحكم في متى يعاد تشغيل العداد التراكمي:
- لا شيء: مستمر من بداية الرسم البياني.
- يوم: يعاد التعيين في كل يوم جديد (انحياز داخل اليوم).
- أسبوع: يعاد التعيين في كل أسبوع جديد (تأرجح).
- شهر: يعاد التعيين في كل شهر جديد (انحياز إطار زمني أعلى).
فترة EMA ل Delta (0 = إيقاف)
- يطبق EMA على Delta لتنعيم المدرج البياني وكشف تغيرات النظام.
- اقتراحات: 5–9 سكالبينج، 10–21 داخل اليوم، 21–34 تأرجح.
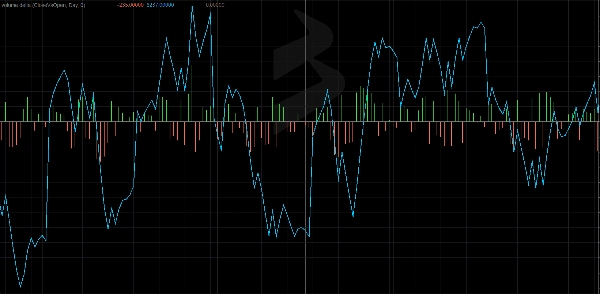
المخرجات / المخازن المؤقتة
- Delta Up (مدرج بياني أخضر): جزء Delta الإيجابي.
- Delta Down (مدرج بياني أحمر): جزء Delta السلبي.
- CVD (خط أزرق): مجموع تراكمي لـ Delta مع إعادة التعيين المختارة.
- Delta EMA (خط برتقالي، اختياري): Delta المنعم.
- صفر (خط رمادي): خط الأساس للمقارنة السريعة.
كيفية قراءته
- Delta > 0 → هيمنة الشراء العدواني في الشريط.
- Delta < 0 → هيمنة البيع العدواني في الشريط.
- ارتفاع CVD → تراكم؛ انخفاض CVD → توزيع.
- التباينات
-
- السعر يصنع قممًا أعلى بينما CVD يفشل في التأكيد → احتمال نفاد ضغط الشراء.
- السعر يصنع قيعانًا أدنى بينما CVD يفشل في التأكيد → احتمال نفاد ضغط البيع.
كتب اللعب العملية
- تأكيد الاختراق: يفضل الاختراقات الطويلة عندما يتسارع CVD و يتحول Delta EMA إلى إيجابي.
- تلاشي الامتدادات: ابحث عن تباينات السعر مقابل CVD عند المستويات الرئيسية (VWAP/Anchored VWAP، دعم/مقاومة).
- انحياز الجلسة: مع إعادة تعيين CVD = يوم، اقرأ الاتجاه السائد داخل اليوم.
البدء السريع
- قم بإرفاق المؤشر.
- ابدأ بـ طريقة Delta = MFM، إعادة تعيين CVD = يوم، EMA = 10 (داخل اليوم).
- على الرسوم البيانية الصاخبة، زد EMA أو انتقل إلى CloseVsOpen.
- ابحث عن التوافق مع Anchored VWAP، دعم/مقاومة ثابت/ديناميكي، أو أنماط حركة السعر.
الأداء والتوافق
- واجهات برمجة التطبيقات الحديثة (
Bars.*،LineColor). - حسابات غير معاد رسمها.
- يعمل على أي رمز وإطار زمني.
الملخص
The indicator supports three Delta calculation methods: CloseVsPrevClose (responsive for intraday shifts), CloseVsOpen (reduces noise by focusing on directional bars), and Money Flow Multiplier (MFM) which weights intra-bar volume for smoother results. An optional Exponential Moving Average (EMA) smoothing can be applied to Delta to highlight regime changes.
Outputs include separate histograms for positive and negative Delta, the CVD line, an optional Delta EMA line, and a zero baseline for reference. Traders can use the indicator to confirm breakouts, identify divergences between price and volume flow, and assess order-flow pressure. It works on any symbol and timeframe, supporting markets such as Forex, indices, commodities, stocks, and cryptocurrencies.