
Breakout channel
مؤشر
527 التنزيلات
الإصدار 1.0، Nov 2025
Windows, Mac
الوصف
قنوات الاختراق
ما تفعله
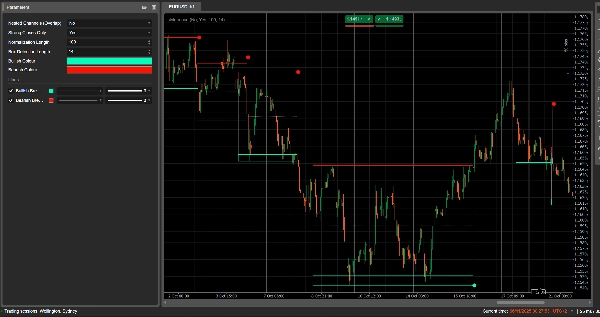
قنوات الاختراق تكتشف تلقائيًا نطاقات التوحيد (صناديق السعر) وتحدد نقاط الاختراق عندما يخرج السعر من تلك النطاقات.
ترسم:
- صندوق قناة رمادي حول منطقة التوحيد
- شريط علوي أحمر (مقاومة محتملة)
- شريط سفلي أخضر (دعم محتمل)
- خط منتصف أبيض منقط (منتصف القناة)
- نقاط ملونة عند حدوث اختراق:
-
- نقطة خضراء/سماوية أسفل الصندوق → اختراق صعودي
- نقطة حمراء فوق الصندوق → اختراق هبوطي
الفكرة هي إبراز المناطق بصريًا حيث يتجمع السعر وحيث من المحتمل أن تبدأ تحركات قوية عند كسر النطاق.
كيفية الحساب
- تطبيع السعر
-
- خلال آخر طول التطبيع من الأعمدة يجد أعلى قمة و أدنى قاع.
- يقوم بتطبيع الإغلاق إلى نطاق 0–1:
normalizedPrice=Close−LowestLowHighestHigh−LowestLow\text{normalizedPrice} = \frac{\text{Close} - \text{LowestLow}}{\text{HighestHigh} - \text{LowestLow}}normalizedPrice=HighestHigh−LowestLowClose−LowestLow
- مقياس التقلب
-
- يحسب الانحراف المعياري للسعر المطبع خلال 14 عمودًا.
- هذا يعطي سلسلة تقلب تُستخدم لاكتشاف نقاط التحول في هيكل السوق.
- خطوط التقلب العلوية / السفلية
-
- خلال آخر (طول اكتشاف الصندوق + 1) من الأعمدة، يجد:
-
- العمود حيث كان التقلب الأعلى
- العمود حيث كان التقلب الأدنى
- من عدد الأعمدة التي مضت منذ حدوث هذه القمم والقيعان، يبني خطين اصطناعيين: العلوي و السفلي.
- التقاطع بين هذين الخطين يشير إلى بداية/نهاية محتملة لمرحلة القناة.
- بداية القناة ومدة استمرارها
-
- عندما يتقاطع الخط السفلي فوق العلوي، يشير المؤشر إلى بداية محتملة للقناة.
- من ذلك العمود يتتبع المدة و أعلى قمة / أدنى قاع خلال الفترة.
- إنشاء القناة
-
- عندما يتقاطع الخط العلوي مرة أخرى فوق السفلي، وكانت المدة أكبر من 10 أعمدة:
-
- يحدد القناة الأعلى كأعلى قمة في تلك الفترة.
- يحدد القناة الأسفل كأدنى قاع.
- يقيس ATR/2 الحالي لفصل منطقة رقيقة في الأعلى والأسفل:
-
- شريط أحمر في الأعلى (شريط هبوطي)
- شريط أخضر في الأسفل (شريط صعودي)
- يرسم:
-
- مستطيل رمادي الإطار (القناة كاملة)
- خط علوي أحمر الإطار
- خط سفلي أخضر الإطار
- خط منتصف أبيض منقط عبر المركز
- تبقى القنوات على الرسم البياني كهيكل تاريخي (لا تُحذف بعد الاختراق).
- كشف الاختراق
-
- لكل قناة نشطة، في كل عمود جديد يحسب سعر مرجعي:
-
- إذا كان الإغلاقات القوية فقط = true → يستخدم منتصف جسم الشمعة:
refPrice=(Open+Close)/2\text{refPrice} = (\text{Open} + \text{Close})/2refPrice=(Open+Close)/2
هذا يتطلب أن يكون أكثر من نصف الجسم خارج الصندوق. - إذا كان الإغلاقات القوية فقط = false → يستخدم الإغلاق البسيط.
- إذا كان الإغلاقات القوية فقط = true → يستخدم منتصف جسم الشمعة:
- قواعد الاختراق:
-
- إذا كان
refPrice > Top→ اختراق صعودي -
- يرسم نقطة خضراء عند أسفل القناة.
- يعطل هذه القناة (يتوقف عن تمديدها)، لكن الصندوق يبقى مرئيًا.
- إذا كان
refPrice < Bottom→ اختراق هبوطي -
- يرسم نقطة حمراء عند أعلى القناة.
- يعطل القناة.
- وإلا، تظل القناة نشطة ويتم تمديد حافتها اليمنى إلى العمود الحالي.
- إذا كان
- خيار القنوات المتداخلة
-
- إذا كان القنوات المتداخلة = true، يمكن أن تتداخل قنوات متعددة في الوقت والسعر.
- إذا كان false، يمنع المؤشر إنشاء قناة جديدة قد تتداخل مع قناة موجودة.
كيفية القراءة والاستخدام
- الصندوق الرمادي (القناة)
-
- يمثل منطقة التوحيد / التوازن حيث كان السعر يتداول لفترة.
- كلما كان الصندوق أطول وأعلى، كان النطاق أكثر أهمية.
- الشريط العلوي الأحمر (منطقة المقاومة)
-
- الجزء العلوي من القناة، مبرز بصريًا كـ منطقة مقاومة محتملة.
- الرفض المتكرر بالقرب من هذا الشريط يشير إلى ضغط بيع داخل النطاق.
- الشريط السفلي الأخضر (منطقة الدعم)
-
- الجزء السفلي من القناة، مبرز كـ دعم محتمل.
- الارتدادات المتكررة تشير إلى مشتريين يدافعون عن الحافة السفلية للنطاق.
- خط منتصف أبيض منقط
-
- هو منتصف القناة – نوع من "القيمة العادلة" المحلية.
- تذبذب السعر حول هذا الخط يشير إلى توازن؛ التحركات القوية بعيدًا غالبًا ما تسبق اختبار الشريط المقابل.
- نقاط الاختراق
-
- نقطة خضراء أسفل الصندوق:
-
- أغلق السعر بقوة فوق أعلى القناة (أو ببساطة أغلق فوقها، حسب الإغلاقات القوية فقط).
- يشير إلى اختراق صعودي – بداية محتملة لتحرك صعودي من ضغط تقلب.
- نقطة حمراء فوق الصندوق:
-
- أغلق السعر بقوة تحت أسفل القناة.
- يشير إلى اختراق هبوطي – بداية محتملة لتحرك هبوطي.
- طرق الاستخدام النموذجية (على مستوى الفكرة)
-
- اختراقات تتبع الاتجاه
-
- تداول في اتجاه الاختراق (اشترِ بعد النقطة الخضراء، بيع بعد النقطة الحمراء)، ويفضل أن يكون ذلك بالتوافق مع اتجاه إطار زمني أعلى أو مؤشرات أخرى.
- الفلترة والتأكيد
-
- استخدم القناة واختراقها فقط كـ فلتر لاستراتيجيتك الحالية (مثلاً، خذ صفقات شراء فقط إذا كان الإشارة الأخيرة اختراقًا صعوديًا).
- تحديد المخاطر
-
- بالنسبة للاختراقات الصعودية، يضع العديد من المتداولين أوامر وقف الخسارة داخل القناة السابقة أو أسفلها مباشرة؛ وللهبوطية، داخل الصندوق أو فوقه.
الملخص
ملخص الذكاء الاصطناعي
Breakout Channels is a technical indicator designed to identify consolidation zones and signal potential price breakouts. It automatically detects price ranges where the market is coiling, marking these with a grey channel box that highlights the consolidation area. The indicator draws a red upper band indicating potential resistance, a green lower band indicating potential support, and a white dotted midline representing the channel midpoint or local fair value.
Breakout points are signaled by colored dots: a green or cyan dot below the box indicates a bullish breakout, while a red dot above signals a bearish breakout. The indicator calculates these zones by normalizing price data, measuring volatility through the standard deviation of normalized prices, and identifying volatility extremes to define channel start and duration.
Channels remain visible on the chart as historical structures even after breakouts. Users can enable nested channels to allow overlapping consolidation zones. Breakout detection uses either candle body midpoints or close prices, depending on settings, to confirm strong closes outside the channel.
Typical uses include trading in the breakout direction, filtering existing strategies, and placing risk stops near channel boundaries. The indicator supports various markets including forex, indices, commodities, stocks, and cryptocurrencies.
ملف تعريف المؤشر
تقييمات العملاء
0.0
التقييمات: 0
تقييمات العملاء
لا توجد تقييمات لهذا المنتج حتى الآن. هل جرَّبته بالفعل؟ كن أول من يخبر الآخرين!
مناقشة
الأسئلة الشائعة
Signal
Indices
Commodities
GBPUSD
RSI
Bollinger
Fibonacci
Scalping
AI
XAUUSD
NAS100
MACD
BTCUSD
Forex
Breakout
EURUSD
NZDUSD
Martingale
Prop
ZigZag
Supertrend
Fair Value Gap
SMC
Crypto
Grid
Stocks
ATR
USDJPY
VWAP
يتم توفير المنتجات المتاحة من خلال cTrader Store، بما في ذلك روبوتات التداول والمؤشرات والإضافات، من قبل مطوري الطرف الثالث وإتاحتها لأغراض الوصول المعلوماتي والفني فقط. cTrader Store ليس وسيطًا ولا يقدم نصائح استثمارية أو توصيات شخصية أو أي ضمان للأداء المستقبلي.


السعر
42.11M
حجم التداول
6.13M
الربح بالبيب
231
المبيعات
8.56K
التثبيتات المجانية