
Simple ICT Concepts
مؤشر
3 عمليات الشراء
الإصدار 1.0، Dec 2025
Windows, Mac
4.0
التقييمات: 1
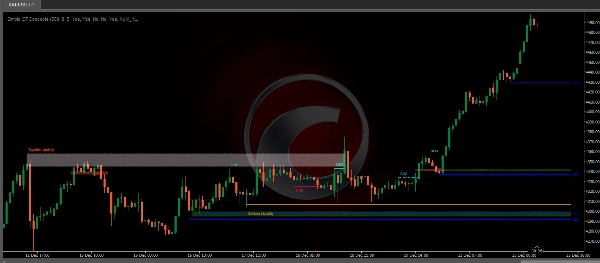
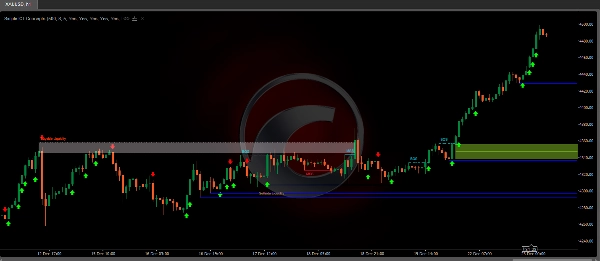
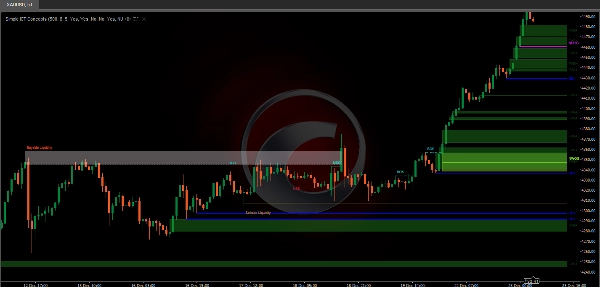
مؤشر مفاهيم تكنولوجيا المعلومات والاتصالات البسيطة هو أداة قوية مصممة لمساعدة المتداولين على تطبيق مبادئ منهجية المتداول الدائري الداخلي (ICT). يركز هذا المؤشر على تحديد المناطق الرئيسية مثل مستويات السيولة، والدعم والمقاومة، وبنية السوق، مما يجعله أداة لا تقدر بثمن لمتداولي حركة السعر ومفاهيم المال الذكي.
الميزات الرئيسية
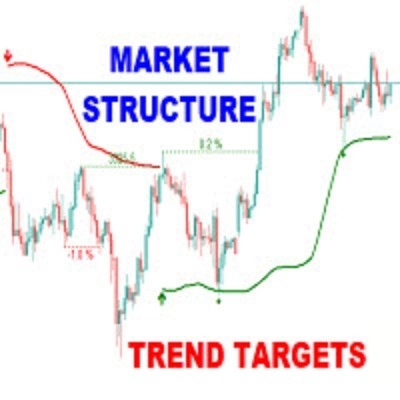
بنية السوق:
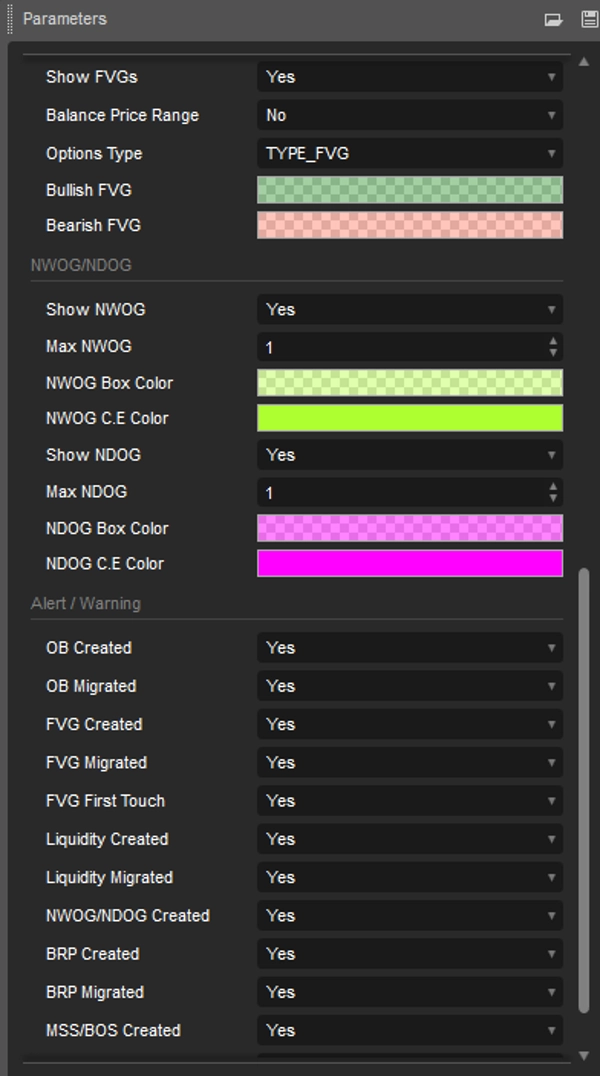
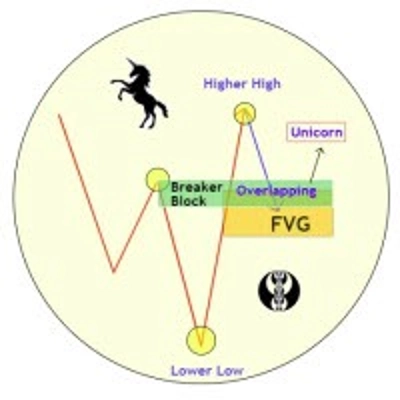
تُبنى تسميات بنية السوق من خلال كسر السعر لنقطة تأرجح سابقة. هذا يسمح للمستخدم بتحديد الاتجاه الحالي للسوق بناءً على حركة السعر.هناك نوعان من تسميات بنية السوق المدرجة:تحول بنية السوق (MSS)كسر البنية (BOS)يحدث MSS عندما يكسر السعر أدنى تأرجح في اتجاه صاعد أو أعلى تأرجح في اتجاه هابط، مما يبرز احتمال انعكاس.غالبًا ما يُسمى هذا "CHoCH"، لكن ICT يحدده كـ MSS. من ناحية أخرى، تحدث تسميات BOS عندما يكسر السعر أعلى تأرجح في اتجاه صاعد أو أدنى تأرجح في اتجاه هابط.يحدث ظهور هذه النقاط التأرجحية الخاصة بسبب التصحيحات (التحفيزات) التي تبرز البحث عن السيولة في الأطر الزمنية الأقل.نقاط التأرجح الرئيسية: أعلى ارتفاعات (HH) وأدنى انخفاضات (LL)، وأعلى انخفاضات (HL) وأدنى ارتفاعات (LH)الإزاحة:الإزاحات هي سيناريوهات حيث يشكل السعر شموعًا متتالية بنفس الاتجاه (صعودي/هبوطي) بأجسام كبيرة وظلال قصيرة.يمكن تحديدها بشكل أكثر تقنية من خلال الارتباط التلقائي الإيجابي (حيث من المرجح أن يتبع تغيير الإغلاق إلى الافتتاح تغييرًا بنفس الإشارة) بالإضافة إلى تجمع التقلبات (حيث تتبع التغيرات الكبيرة تغيرات كبيرة).يمكن أن تكون الإزاحات سببًا في تكوين الاختلالات وكذلك بنية السوق، ويمكن أن تحدث بسبب التنفيذ الكامل لأمر ميتا.اختلال الحجم:يحدث اختلال الحجم (V.I.) عندما يكون هناك منطقة سعرية تُركت بدون جسم شمعة. هناك حركة صعود وهبوط في تداخل الظلال، ومع ذلك نظرًا لأن الجزء الأكبر من الحجم في جسم الشمعة، نطلق على هذا اختلال الحجم.كتل الأوامر:كتلة أوامر ICT (المتداول الدائري الداخلي) هي منطقة سعرية على الرسم البياني حيث يضع المستثمرون المؤسسيون الكبار أوامر شراء أو بيع كبيرة. كتل الأوامر هي مفهوم رئيسي في التداول، حيث يمكن أن تساعد المتداولين على تحديد مستويات الدعم والمقاومة المحتملة، وتوقع انعكاسات السعر.السيولة:تُبرز مستويات السيولة على جانب الشراء/البيع مستويات السعر حيث قد يضع المشاركون في السوق أوامر حد/إيقاف.ستجمع مستويات سيولة جانب الشراء أوامر وقف الخسارة للمتداولين القصيرين بالإضافة إلى أوامر الحد للمتداولين الطويلين، بينما تجمع مستويات سيولة جانب البيع أوامر وقف الخسارة للمتداولين الطويلين بالإضافة إلى أوامر الحد للمتداولين القصيرين.يمكن أن تلعب هذه المستويات أدوارًا مختلفة. قد يرى المشاركون في السوق الأكثر اطلاعًا هذه المستويات كمصدر للسيولة، ومتى ما تم تقليل السيولة فوق مستوى معين سيتم العثور عليها في منطقة أخرى.FVG/IFVG:فجوات القيمة العادلة: تشكيل من ثلاث شموع حيث لا تتداخل ظلال الشموع المجاورة للشمعة المركزية، مما يبرز منطقة فجوة.فجوات القيمة العادلة الضمنية: على عكس فجوة القيمة العادلة، فإن فجوة القيمة العادلة الضمنية تحتوي على ظلال شموع مجاورة للشمعة المركزية متداخلة. يتم بناء منطقة الفجوة من المتوسط بين الظل المعني وأقرب طرف من جسم الشمعة.نطاق السعر المتوازن: تحدث نطاقات السعر المتوازنة عندما تتداخل فجوة قيمة عادلة مع فجوة قيمة عادلة سابقة، مع أن تؤدي المنطقة المتداخلة إلى منطقة اختلال.NWOG/NDOG:يكشف هذا المؤشر عن فجوات افتتاح الأسبوع الجديد (NWOG) وفجوات افتتاح اليوم الجديد (NDOG). NWOG هي الفجوة بين سعر إغلاق يوم الجمعة وسعر افتتاح يوم الأحد. NDOG هي الفجوة بين سعر الافتتاح وسعر الإغلاق لليوم السابق.
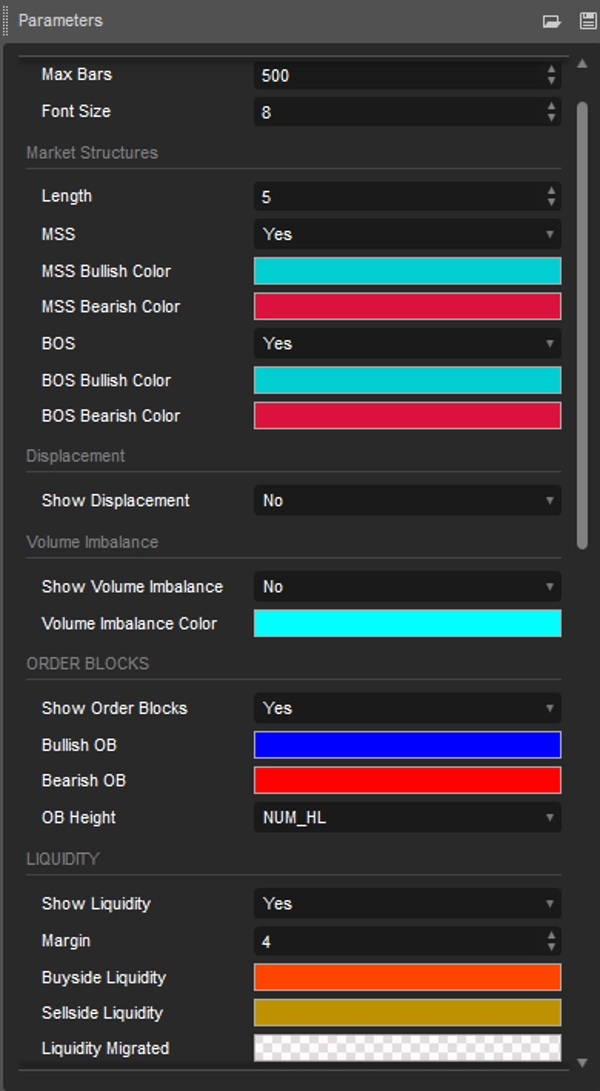
ميزات قابلة للتخصيص
يمكن للمستخدمين تعديل الإعدادات مثل طول البيانات، والألوان، وأنماط العرض لتتناسب مع تفضيلاتهم في التداول.
فوائد للمتداولين
يوفر الوقت في التحليل اليدوي، مما يعزز كفاءة التداول.
يساعد على اتخاذ قرارات سريعة ومستنيرة خلال ظروف السوق المتقلبة.
سهل الاستخدام لكل من المبتدئين والمتداولين ذوي الخبرة.
الخاتمة
مؤشر مفاهيم تكنولوجيا المعلومات والاتصالات البسيطة ليس مجرد أداة بل هو حل شامل للمتداولين الذين يتطلعون إلى تنفيذ استراتيجيات ICT بفعالية. إنه خيار قوي لتعزيز تحليل السوق وتنفيذ الصفقات بدقة.
ملف تعريف المؤشر
4.0
التقييمات: 1
5 | 0 % | |
4 | 100 % | |
3 | 0 % | |
2 | 0 % | |
1 | 0 % |
تقييمات العملاء
December 27, 2025
The signal still needs a chart check, no surprise there. One green trade proves nothing.
BTCUSD
Forex
Signal
Fair Value Gap
Crypto
XAUUSD
NAS100
يتم توفير المنتجات المتاحة من خلال cTrader Store، بما في ذلك روبوتات التداول والمؤشرات والإضافات، من قبل مطوري الطرف الثالث وإتاحتها لأغراض الوصول المعلوماتي والفني فقط. cTrader Store ليس وسيطًا ولا يقدم نصائح استثمارية أو توصيات شخصية أو أي ضمان للأداء المستقبلي.


![شعار "[Stellar Strategies] Market Session Ultimate"](https://cdn.ctrader.com/image/webp/61ffd537-0125-4246-9e72-42eca1791d64_28232)

36
المبيعات
2.23K
التثبيتات المجانية