
الوصف
المذبذب الانحدار الخطي (LRO) هو مؤشر فني يعتمد على تحليل الانحدار الخطي، يُستخدم عادة في الأسواق المالية لتقييم الزخم واتجاه اتجاهات الأسعار. يقيس المسافة بين السعر الحالي والقيمة المتوقعة بواسطة خط الانحدار الخطي، وهو في الأساس خط الانحدار الأفضل ملاءمة خلال فترة محددة. إليك تفصيل لكيفية عمله ومكوناته:
المكونات الرئيسية لمذبذب الانحدار الخطي
- خط الانحدار الخطي (خط أفضل ملاءمة): يمثل هذا الخط حركة السعر المتوقعة خلال فترة معينة ويتم حسابه باستخدام تقنيات الانحدار الخطي. يشير ميل الخط إلى اتجاه الاتجاه: الميل الإيجابي يشير إلى اتجاه صعودي، بينما يشير الميل السلبي إلى اتجاه هبوطي.
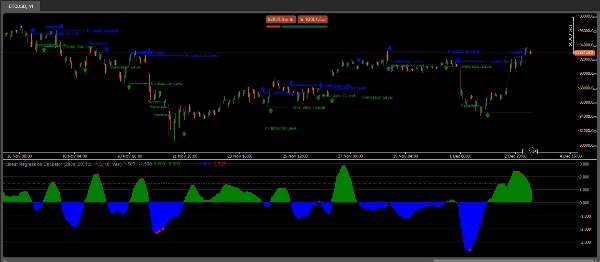
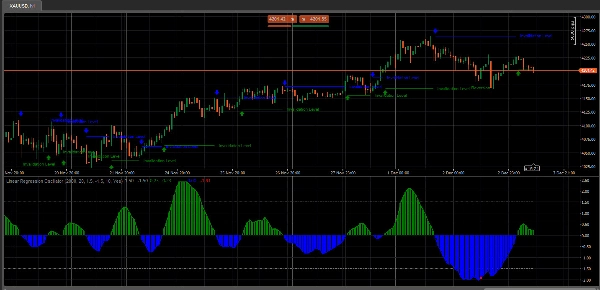
- قيم المذبذب: يتم حساب قيمة المذبذب بقياس الانحراف بين السعر الحالي وخط الانحدار الخطي. يتم رسم هذا الانحراف كقيمة مذبذب، عادة ما يتأرجح حول خط الصفر.
- خط الصفر: يعمل خط الصفر في مخطط LRO كخط أساس. عندما يتجاوز قيمة المذبذب خط الصفر للأعلى، يشير ذلك إلى زخم صعودي، وعندما يتجاوز للأسفل يشير إلى زخم هبوطي.
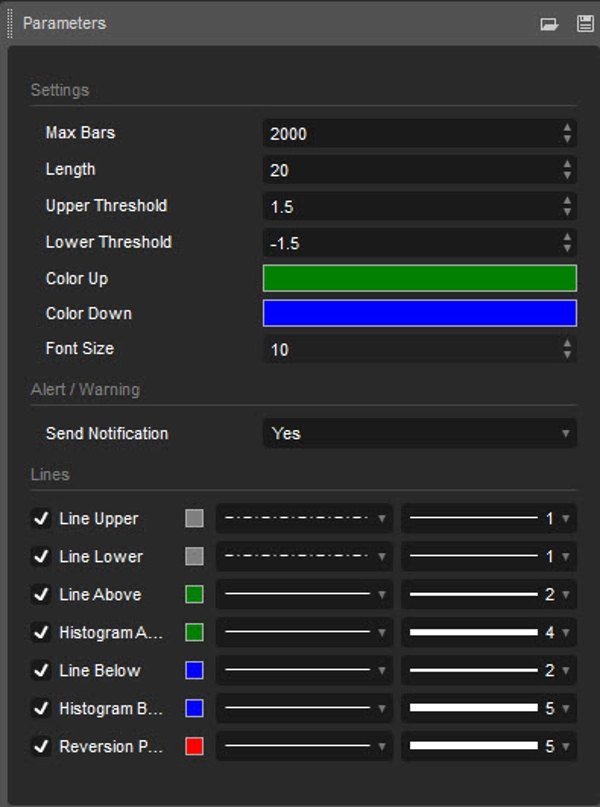
- الإعدادات والفترات: يحدد إعداد الفترة عدد الأعمدة أو نقاط البيانات التي تؤخذ في الاعتبار لحساب خط الانحدار الخطي. يقوم المتداولون بضبط هذا الإعداد ليناسب استراتيجيات التداول قصيرة أو طويلة الأجل، اعتمادًا على الإطار الزمني المفضل لديهم للتحليل.
كيف يستخدم المتداولون مذبذب الانحدار الخطي
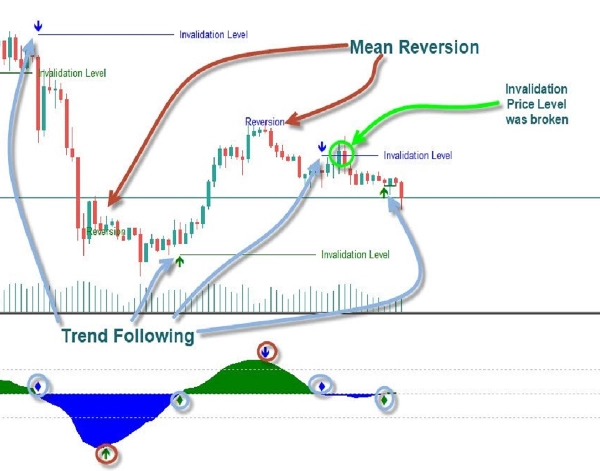
- تحديد الاتجاهات: يساعد LRO المتداولين على رؤية ما إذا كان اتجاه السعر الحالي يمتلك زخمًا من خلال إظهار المسافة النسبية بين السعر وخط الانحدار المتوقع.
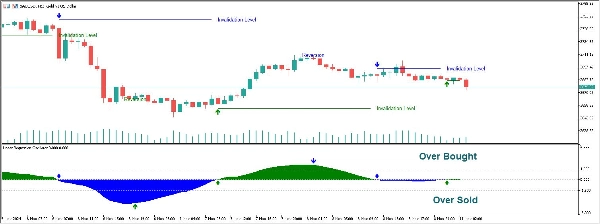
- مستويات الشراء المفرط/البيع المفرط: يمكن أن تشير القيم القصوى في المذبذب إلى حالات شراء مفرط أو بيع مفرط، مما يشير إلى احتمال حدوث انعكاس أو الحاجة إلى تعديل المراكز.
- إشارات التباعد: عندما تتباعد تحركات السعر ومؤشر LRO، يمكن أن يشير ذلك إلى ضعف الزخم أو احتمال حدوث انعكاس.
نصائح التفسير
- عبور خط الصفر: قد يشير العبور فوق الصفر إلى ظهور اتجاه صعودي، بينما يشير العبور تحت الصفر إلى اتجاه هبوطي.
- تعديل الفترات: تجعل الفترات الأقصر LRO أكثر حساسية، مما يلتقط تحركات السعر السريعة لكنه يزيد من الضوضاء. الفترات الأطول تُنعّم التقلبات، مما يجعلها مناسبة لتحديد الاتجاهات طويلة الأجل.
ملاحظات الاستخدام:
- الطول: يحدد الفترة التي يتم خلالها حساب الانحدار الخطي
- العتبة العليا/السفلى: تحدد الحدود العليا والسفلى لتحديد حالات الشراء المفرط والبيع المفرط. تشير القيم خارج هذه العتبات إلى احتمالات انعكاس.
يُقدّر مذبذب الانحدار الخطي لدمجه التحليل الإحصائي مع مبادئ متابعة الاتجاه، مما يجعله أداة متعددة الاستخدامات لكل من متداولي الزخم والاتجاه. وهو مفيد بشكل خاص في الأسواق ذات الاتجاهات حيث يساعد في تحديد استمرار الاتجاهات أو الانعكاسات بناءً على الانحرافات عن خط الاتجاه الانحداري.
الملخص
تقييمات العملاء
5 | 0 % | |
4 | 100 % | |
3 | 0 % | |
2 | 0 % | |
1 | 0 % |


![شعار "[CB] Pivot Points Pro"](https://cdn.ctrader.com/image/webp/43463c82-67b0-4f10-a4ba-901bba091d81_32594)
