
Mô tả
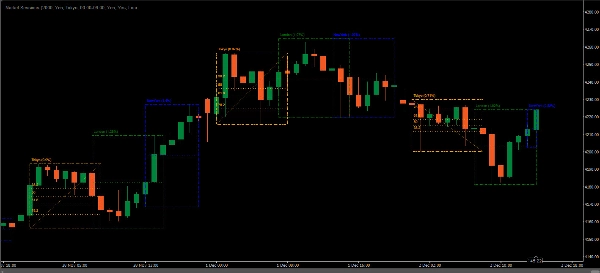
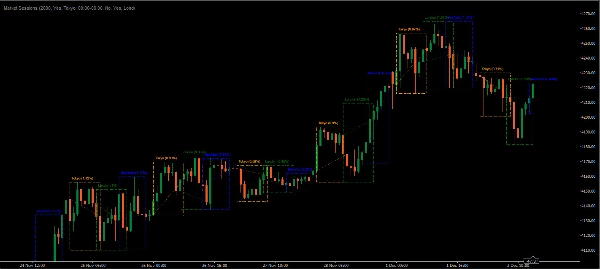
Chỉ báo Phiên Thị trường là một công cụ phổ biến trong số các nhà giao dịch forex và cổ phiếu để thể hiện trực quan các phiên giao dịch toàn cầu trên biểu đồ giá. Nó làm nổi bật các khoảng thời gian của các phiên giao dịch chính — chẳng hạn như Châu Á (Tokyo), Châu Âu (London), và Mỹ (New York) trực tiếp trên biểu đồ. Điều này giúp các nhà giao dịch xác định khi nào thị trường mở và đóng cửa, cho phép đưa ra quyết định tốt hơn dựa trên hành vi giao dịch theo từng phiên.
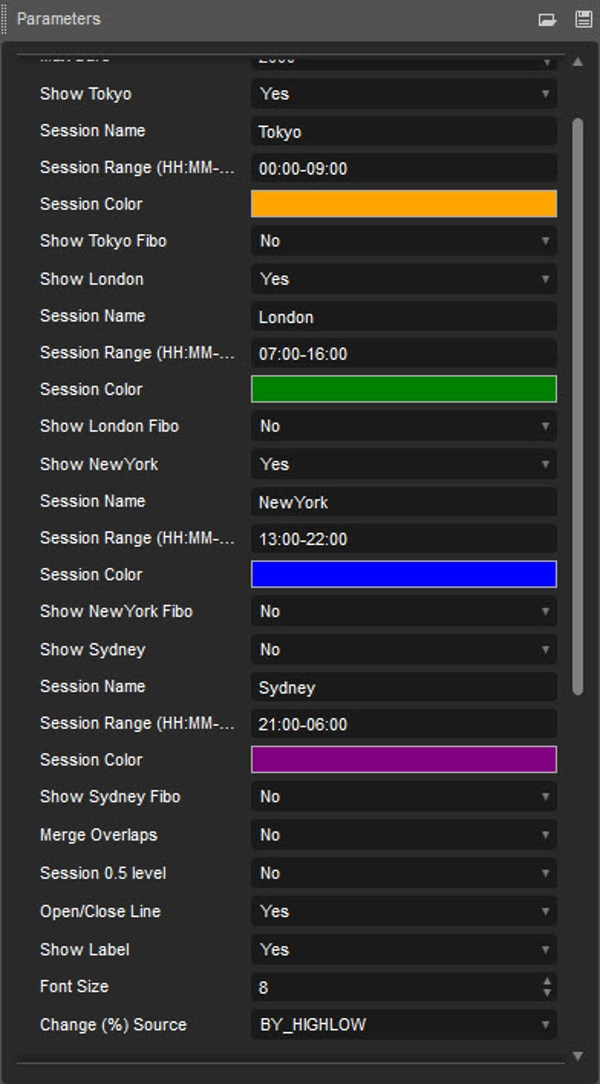
- Phiên Châu Á (Mặc định: 00:00-09:00)
- Phiên London (Mặc định: 07:00-16:00)
- Phiên New York (Mặc định: 13:00-22:00)
- Phiên Sydney (Mặc định: 21:00-06:00)
Các Tính Năng Chính của Chỉ Báo Phiên Thị Trường
- Thời Gian Phiên và Các Khoảng Giao:
-
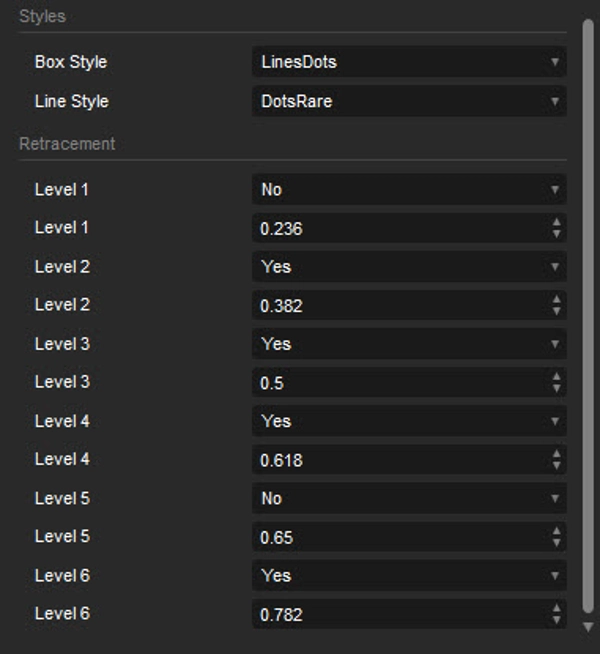
- Chỉ báo đánh dấu thời gian bắt đầu và kết thúc cho mỗi phiên. Tính năng này hữu ích vì mỗi phiên có đặc điểm riêng biệt — ví dụ, phiên Châu Á thường yên tĩnh hơn, trong khi phiên London thường có biến động cao. Các khoảng giao nhau, như khoảng giao giữa London và New York, cũng được đánh dấu, chỉ ra thời điểm hoạt động tăng cao.
- Màu Phiên Có Thể Tùy Chỉnh:
-
- Các nhà giao dịch thường có thể tùy chỉnh màu sắc cho từng phiên, giúp dễ dàng phân biệt trực quan giữa các phiên. Việc cá nhân hóa này làm tăng sự rõ ràng và giúp các nhà giao dịch tập trung vào các phiên mà họ ưu tiên.
- Múi Giờ Có Thể Điều Chỉnh:
-
- Vì các nhà giao dịch nằm ở nhiều nơi trên thế giới, chỉ báo thường cho phép điều chỉnh múi giờ, căn chỉnh thời gian bắt đầu và kết thúc phiên với giờ địa phương của nhà giao dịch, điều này đặc biệt hữu ích cho những người ở múi giờ khác với các trung tâm giao dịch chính.
- Chiến Lược Riêng Cho Từng Phiên:
-
- Mỗi phiên có đặc điểm riêng biệt. Ví dụ, phiên London thường biến động nhất, mang lại cơ hội bứt phá, trong khi phiên Châu Á thường yên tĩnh hơn, phù hợp với các chiến lược giao dịch trong phạm vi. Hiểu được những điểm khác biệt này giúp các nhà giao dịch điều chỉnh chiến lược dựa trên xu hướng của từng phiên.
Tại Sao Nên Sử Dụng Chỉ Báo Phiên Thị Trường?
- Thời Điểm Giao Dịch Tốt Hơn:
-
- Bằng cách biết phiên nào đang hoạt động, các nhà giao dịch có thể điều chỉnh chiến lược để tận dụng các mức độ biến động và thanh khoản khác nhau.
- Phân Tích và Phát Triển Chiến Lược Cải Thiện:
-
- Với thời gian phiên được đánh dấu trực quan, các nhà giao dịch có thể phân tích hành vi giá qua các phiên để phát triển và hoàn thiện các chiến lược phù hợp nhất với đặc điểm của từng phiên.
- Tăng Nhận Thức Về Biến Động Thị Trường:
-
- Biến động thường tăng cao trong các thời điểm mở cửa, đóng cửa và giao nhau của các phiên. Chỉ báo giúp dự đoán những biến động này, giảm khả năng bị bất ngờ bởi các biến động đột ngột của thị trường.
Ví Dụ Về Trường Hợp Sử Dụng
Một nhà giao dịch quan tâm đến biến động có thể nhắm vào khoảng giao giữa London và New York để tận dụng sự chuyển động mạnh hơn của thị trường. Bằng cách sử dụng chỉ báo Phiên Thị trường, họ có thể lên kế hoạch giao dịch trùng với khoảng giao này, có thể tăng cơ hội nắm bắt các biến động giá đáng kể.
Tóm lại, chỉ báo Phiên Thị trường là công cụ thiết yếu cho các nhà giao dịch muốn đưa ra quyết định thông minh dựa trên hành vi thị trường theo thời gian. Nó cung cấp sự rõ ràng, nâng cao phân tích và có thể hỗ trợ các chiến lược giao dịch hiệu quả hơn.
Tóm tắt
Đánh giá của khách hàng
5 | 33 % | |
4 | 67 % | |
3 | 0 % | |
2 | 0 % | |
1 | 0 % |


