
PIVOT POINTS, HIGH-LOW OF THE DAY
مؤشر
108 التنزيلات
الإصدار 1.0، Mar 2026
Windows, Mac
الوصف
نقاط القمة والقاع والنقاط المحورية هو مؤشر تراكب في cTrader يرسم مستويات السعر اليومية للقمة/القاع والنقاط المحورية الكلاسيكية مباشرة على الرسم البياني الخاص بك.
المعلمات بنظرة سريعة:
المجموعة ما تتحكم به
القمة-القاع
إظهار/إخفاء الخطوط؛ عدد الأيام السابقة للعرض (أيام الرجوع)
النقاط المحورية
إظهار/إخفاء الخطوط؛ أي إطار زمني يحكم حساب النقطة المحورية (يومي، أسبوعي، إلخ)
اللوحة
إظهار/إخفاء مربع المعلومات على الرسم البياني الذي يعرض الأسعار الحالية ومستويات النقاط المحورية
الخطوط
السُمك، النمط (صلب / منقط / منقط جداً)، واللون لخطوط القمة، القاع، PP، المقاومة، والدعم
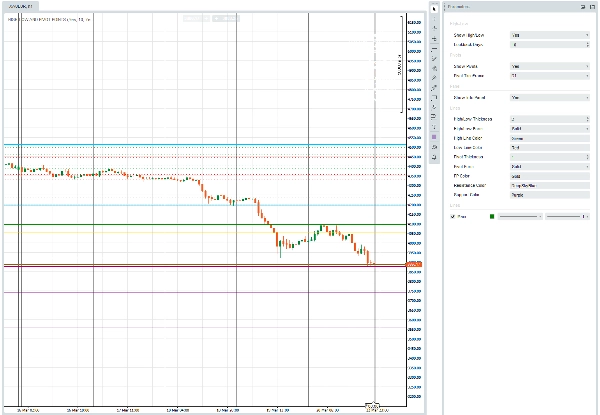
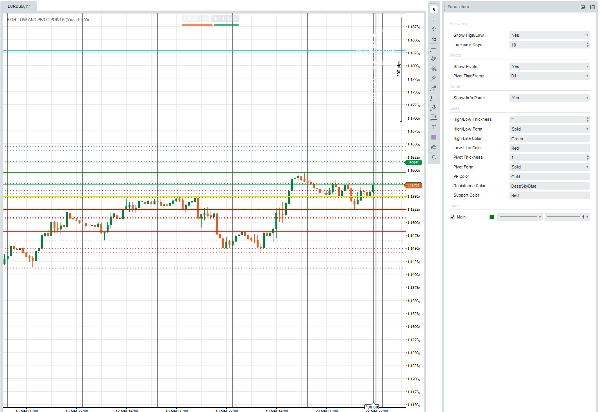
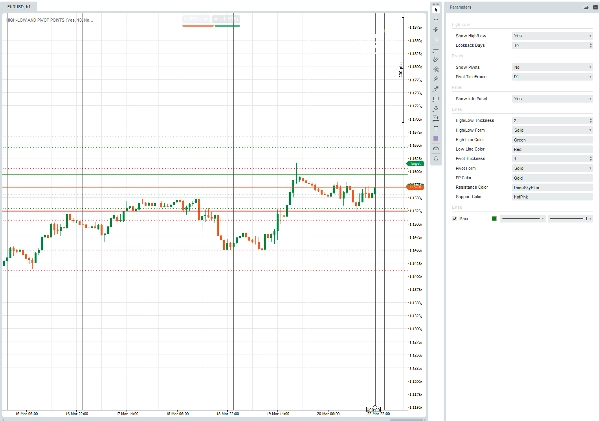
ما يرسمه:
- قمة/قاع اليوم بألوانك المختارة؛ الأيام السابقة في نسخة أخف/أرق من نفس الألوان.
- سبعة مستويات محورية قياسية — PP, R1–R3, S1–S3 — محسوبة من الشمعة المكتملة السابقة للإطار الزمني المحوري المختار.
- لوحة معلومات في الأعلى إلى اليمين تلخص قمة/قاع اليوم الحي، نطاق الرجوع لعدة أيام، وجميع أسعار النقاط المحورية السبعة.
الملخص
ملخص الذكاء الاصطناعي
The "Pivot Points, High-Low of the Day" indicator for cTrader overlays daily high and low price levels along with classic pivot points directly on trading charts. It visually displays today's high and low prices, as well as those from prior days based on a configurable lookback period. The indicator calculates and plots seven standard pivot levels—Pivot Point (PP), Resistance levels R1 to R3, and Support levels S1 to S3—derived from the previous completed bar of a selectable timeframe (e.g., daily or weekly). Users can customize visibility, line thickness, style (solid, dotted, very dotted), and colors for all lines including high, low, pivot, resistance, and support. An optional on-chart info panel summarizes live day high/low, multi-day range, and all pivot prices for quick reference. This tool supports multiple markets and symbols including Forex pairs (EURUSD, GBPUSD, NZDUSD, USDJPY), cryptocurrencies (BTCUSD), commodities (XAUUSD), indices (NAS100), and stocks. It is designed to assist traders in identifying key price levels and potential breakout or reversal points based on historical price data and pivot calculations.
ملف تعريف المؤشر
تقييمات العملاء
0.0
التقييمات: 0
تقييمات العملاء
لا توجد تقييمات لهذا المنتج حتى الآن. هل جرَّبته بالفعل؟ كن أول من يخبر الآخرين!
مناقشة
الأسئلة الشائعة
BTCUSD
Forex
Breakout
Indices
EURUSD
Commodities
GBPUSD
NZDUSD
Crypto
Stocks
XAUUSD
NAS100
USDJPY
يتم توفير المنتجات المتاحة من خلال cTrader Store، بما في ذلك روبوتات التداول والمؤشرات والإضافات، من قبل مطوري الطرف الثالث وإتاحتها لأغراض الوصول المعلوماتي والفني فقط. cTrader Store ليس وسيطًا ولا يقدم نصائح استثمارية أو توصيات شخصية أو أي ضمان للأداء المستقبلي.
المزيد من هذا المؤلف


السعر
48
المبيعات
306
التثبيتات المجانية