
Описание
Представляем Stochastic RSI PRO для cTrader, усовершенствованную версию индикатора Stochastic RSI, разработанную для повышения точности вашей торговли.
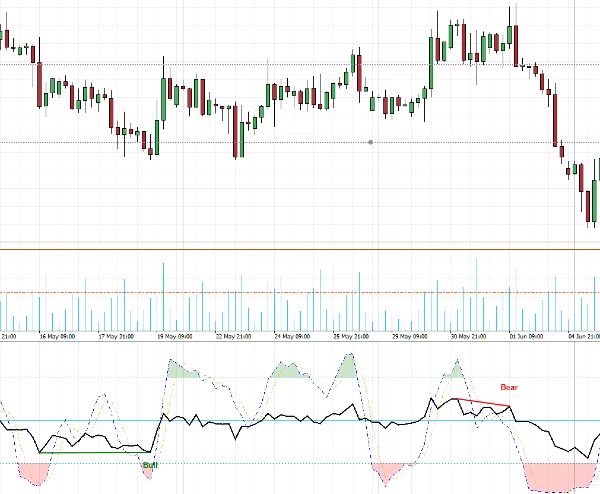
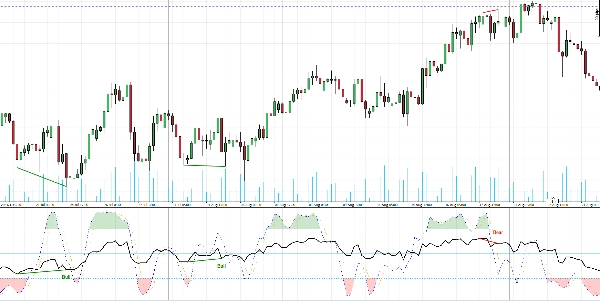
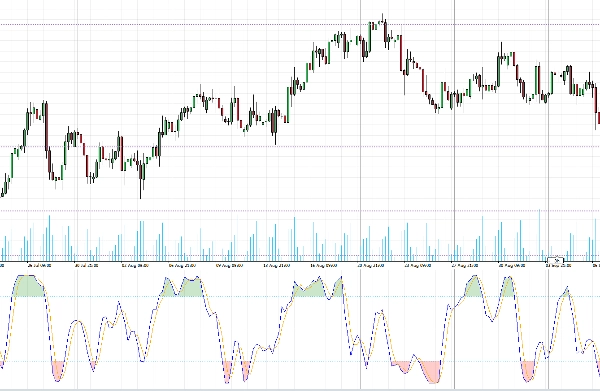
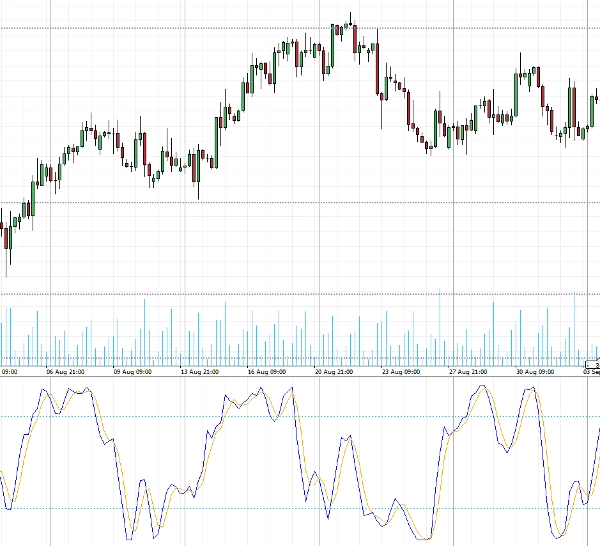
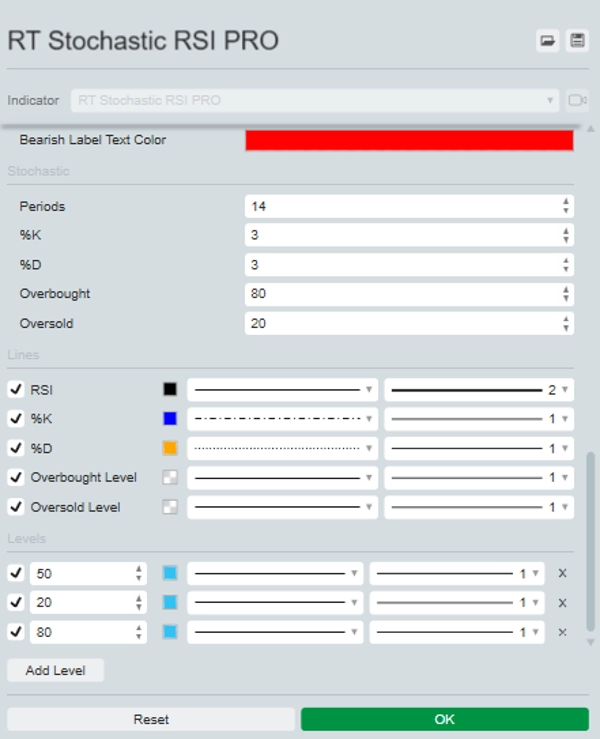
Этот мощный инструмент накладывает RSI непосредственно на Stochastic RSI, обеспечивая всесторонний обзор рыночного импульса. Он выделяет зоны перекупленности и перепроданности с помощью различных цветов для удобного определения.
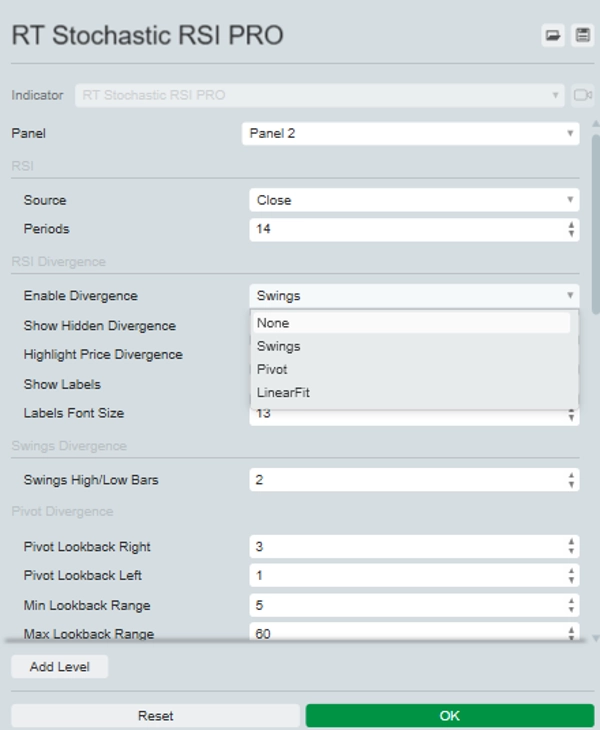
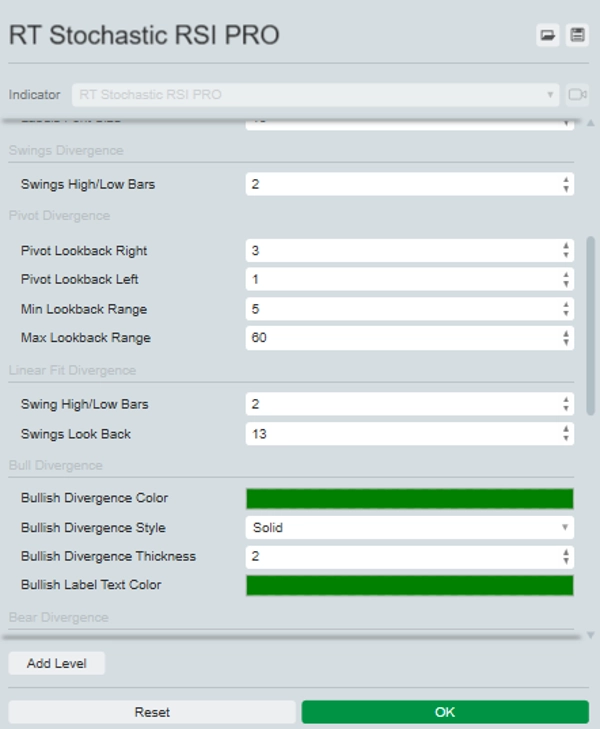
Главная особенность Stochastic RSI PRO — его способность выявлять и при желании выделять как обычные, так и скрытые дивергенции на графике. Вы можете выбрать один из трёх методов определения дивергенций: Swing, Pivot или Linear Fit, каждый с настраиваемыми параметрами для соответствия вашей торговой стратегии.
Повышайте качество анализа и принятия решений с помощью Stochastic RSI PRO — незаменимого инструмента для требовательных трейдеров.


![Логотип продукта "[Stellar Strategies] Smart ADX"](https://cdn.ctrader.com/image/webp/af13b084-b6f6-41db-b7bc-c7e688b57b05_36929)