
説明
オシレーター・ボリンジャーバンドを用いた高度なトレンドダイナミクス
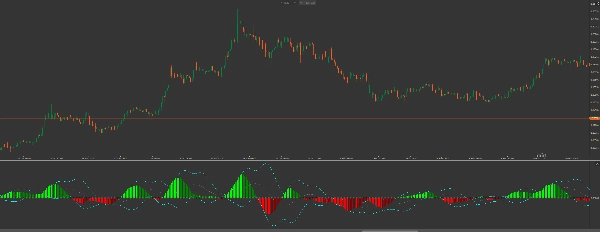
この Squeeze Pro: Momentum & Volatility Suite はcTrader向けの機関投資家レベルのツールキットです。標準的なインジケーターとは異なり、このスイートは市場の動きを二層で分析します: スクイーズフェーズ(市場の圧縮)を特定し、オシレーター自体に直接計算されたボリンジャーバンドを用いて モメンタムの極値を監視します。
主な革新点
-
- モメンタム・ボリンジャーバンド: 初の試みです。モメンタムヒストグラムにBBを適用することで、「買われ過ぎ」や「売られ過ぎ」のモメンタムレベルを特定でき、トレンドが尽きる前の出口タイミングに最適です。
- 三段階スクイーズ検出:
-
- 黒い点(スクイーズオン): 高い圧縮状態。市場が大きなブレイクアウトに向けて「巻きついている」状態です。
- 灰色の点(スクイーズオフ): ボラティリティが拡大中。動きが始まっています。
- 青い点(スクイーズなし): 通常の市場状況です。
- 線形回帰スムージング: 洗練された
CalculateLinearRegressionアルゴリズムを使用し、価格ノイズを除去して滑らかで信頼性の高いヒストグラムを提供します。 - 二重オーバーレイロジック: 別のインジケーターウィンドウで動作し、価格チャートをクリーンに保ちながら深い分析インサイトを提供します。
視覚的インテリジェンスガイド:
-
- ヒストグラム(トレンド&強さ)
-
- ライム: 強気のモメンタムが加速中(強い買い)。
- グリーン: 強気のモメンタムが減速中(利益確定)。
- レッド: 弱気のモメンタムが加速中(強い売り)。
- マルーン: 弱気のモメンタムが減速中(売り手の疲弊)。
- オシレーターバンド(「シアン」ライン)
-
- ヒストグラムバーが シアンのボリンジャーバンド の外に押し出されると、現在のトレンドは統計的な極値にあります。ヒストグラムがこれらのバンド内に戻り始めると、反転や大きな押し戻しを探してください。
トレーディング戦略:「パワーブレイクアウト」
-
- スクイーズを特定する: ゼロラインに 黒い点 が現れるのを待ちます。これは「嵐の前の静けさ」を示します。
- 方向を確認する: 最初の ライム(買い)または レッド(売り)のヒストグラムバーを探します。
- トリガー: スクイーズオフ(灰色の点)が現れ、エネルギーの解放を示したときにトレードに入ります。
- エグジット: ヒストグラムがライムからグリーンに変わったとき、またはヒストグラムが オシレーター上部BB に達したときに利益を確定します。これは疲弊を示します。
なぜSqueeze Proにアップグレードするのか?
基本的なインジケーターは価格が どこに 動いたかを示しますが、Squeeze Pro は動きの背後にある 圧力 を示します。スクイーズとモメンタムバンドを同時に見ることで、すでに疲弊したトレンドへの参入を避け、他の人が見逃す爆発的な動きを捉えることができます。
開発者ノート: このインジケーターはcTraderのAPIに高度に最適化されており、低スペックのマシンでもパフォーマンスの遅延がゼロで、複雑な線形回帰計算をリアルタイムで処理します。
概要
AIによる概要
Squeeze Pro Momentum is an advanced momentum and volatility indicator designed for the cTrader platform. It combines oscillator-based Bollinger Bands applied directly to a momentum histogram with a three-state squeeze detection system to analyze market compression and momentum extremes. The indicator identifies periods of low volatility ("Squeeze On" with black dots), expanding volatility signaling a breakout ("Squeeze Off" with gray dots), and normal market conditions ("No Squeeze" with blue dots).
Key features include linear regression smoothing to reduce price noise, a dual-overlay display that keeps the price chart uncluttered, and a color-coded histogram that visually represents bullish and bearish momentum strength and changes. When histogram bars move outside the oscillator’s Bollinger Bands (cyan lines), it signals statistically extreme momentum levels, useful for timing entries and exits.
The indicator supports a "Power Breakout" trading strategy: traders wait for squeeze signals, confirm momentum direction via histogram colors, enter trades on squeeze release, and exit when momentum shows signs of exhaustion. This suite provides institutional-grade insights into trend pressure and momentum dynamics, helping traders identify potential explosive moves and avoid exhausted trends.
インジケーターのプロフィール
インジケーターのカテゴリー
モメンタム
出力の種類
ビジュアル表示
データ要件
バーのみ
サポート対象のシグナル
ダイバージェンス
クロス
反転
トレンドの強さ
ボラティリティ
ブレイクアウト
カスタマーレビュー
4.0
レビュー: 3
5 | 0 % | |
4 | 100 % | |
3 | 0 % | |
2 | 0 % | |
1 | 0 % |
カスタマーレビュー
May 10, 2026
a week of notes gives a better read. The decision gets a little more breathing room.
May 8, 2026
ディスカッション
よくあるご質問
Bollinger Bands
Keltner Channels
Volume
Channel
ATR
Moving Average
cTrader Storeで入手可能な取引ボット、インジケーター、プラグインなどの商品は、第三者の開発者が提供するものであり、情報と技術の取得のみを目的としてご利用いただけます。cTrader Storeはブローカーではなく、投資助言や個人的な推奨を行うことも、将来のパフォーマンスを保証することもありません。
この作成者の他の商品


これも好きかも


価格
登録日 14/02/2025
10
販売