
Deskripsi
indikator yang mewarnai lilin secara real-time berdasarkan struktur pasar dan menggambar zona likuiditas, aliran institusional, dan rentang konsolidasi. Dirancang untuk trader yang beroperasi di bawah Prinsip Smart Money Concepts (SMC).
🧠 Logika Algoritma
https://chartshots.spotware.com/c/69f0e3fd81319
1. Deteksi Struktur Pasar 🔍
- Menemukan pivot (puncak dan lembah lokal) menggunakan periode lookback yang dapat dikonfigurasi.
- Membandingkan pivot berturut-turut untuk menentukan struktur:
-
- Higher Highs + Higher Lows = Bias Bullish 📈
- Lower Highs + Lower Lows = Bias Bearish 📉
- Sinyal campuran = Bias Netral ➡️
- Menyaring noise: hanya menghitung pivot yang bergerak melewati ambang berdasarkan ATR (Average True Range) dikalikan dengan sensitivitas yang dapat disesuaikan.
https://chartshots.spotware.com/c/69f0e7e752b74
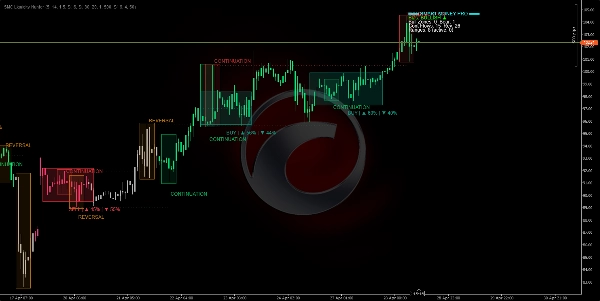
2. Aliran Institusional (Kotak Aliran) 🔄
- Setiap kali pivot signifikan baru terbentuk, algoritma menggambar garis horizontal dari pivot sebelumnya ke pivot baru.
- Mengklasifikasikan aliran sebagai:
-
- Lanjutan: harga menghormati tren (HL dalam uptrend, LH dalam downtrend) ✅
- Pembalikan: harga memecah struktur (LL dalam uptrend, HH dalam downtrend) ⚠️
- Menggambar kotak berwarna di sekitar pivot yang diberi label "LANJUTAN" atau "PEMBALIKAN".
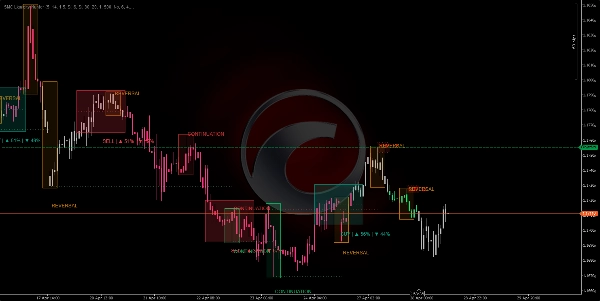
3. Zona Pasokan/Permintaan (Likuiditas) 💧
https://chartshots.spotware.com/c/69f0e8e7aef29
- Di sekitar setiap pivot signifikan, sebuah pita horizontal digambar yang memanjang ke masa depan untuk sejumlah bar yang dapat dikonfigurasi.
- Zona-zona ini mewakili order institusional yang belum dieksekusi:
-
- Pivot bearish → zona PASOKAN (order jual) 🔴
- Pivot bullish → zona PERMINTAAN (order beli) 🟢
- Sebuah zona pecah dan menghilang ketika harga menembusnya dengan kekuatan cukup atau ketika masa berlakunya habis.
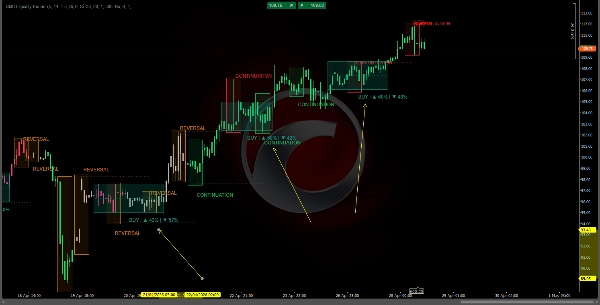
4. Mesin Deteksi Rentang (Konsolidasi) 📦
- Menghitung Simple Moving Average (SMA) dengan pita ATR di sekitarnya.
- Jika setiap bar dalam jendela lookback tetap di dalam pita, algoritma mengidentifikasi rentang konsolidasi.
- Menggambar persegi panjang biru dengan:
-
- Garis tengah putus-putus (keseimbangan rentang) ⚖️
- Persentase probabilitas breakout bullish/bearish berdasarkan:
-
- Momentum arah (ADX/DI+ vs DI-) 📐
- Volume bullish vs bearish kumulatif di dalam rentang 📊
- Waktu yang dihabiskan di bagian atas vs bawah ⏱️
5. Pewarnaan Lilin (Bersih & Visual) 🕯️
- Lilin hijau = struktur bullish terkonfirmasi (HH+HL) 🟢
- Lilin magenta/merah = struktur bearish terkonfirmasi (LH+LL) 🔴
- Lilin abu-abu = fase netral atau transisi ⚪
- Tidak ada persegi panjang yang tumpang tindih: sumbu dan badan lilin asli selalu terlihat jelas.
📋 Dashboard (pojok)
Ringkasan numerik zona aktif, aliran & rentang
🛠️ Cara Menggunakannya
⚙️ Pengaturan yang Direkomendasikan
- Timeframe: H1 atau lebih tinggi (ideal untuk Smart Money).
- Parameter default: bekerja dengan baik untuk Forex, indeks, dan kripto.
- Sesuaikan sensitivitas: tingkatkan untuk pasar yang volatil, kurangi untuk pasar sideways yang berombak.
📗 Aturan Trading :
✅ Entri Long (BELI)
- Lilin harus hijau (bias bullish aktif) 🟢
- Harga menyentuh atau mendekati zona "PERMINTAAN" yang aktif 🟢
- Sebuah "LANJUTAN" kotak (bukan "PEMBALIKAN") muncul di zona tersebut ✅
- Dashboard menunjukkan probabilitas breakout bullish > 60% pada rentang aktif (jika ada) 📊
✅ Entri Short (JUAL)
- Lilin harus magenta/merah (bias bearish aktif) 🔴
- Harga menyentuh atau mendekati zona "PASOKAN" yang aktif 🔴
- Sebuah "LANJUTAN" kotak (bukan "PEMBALIKAN") muncul di zona tersebut ✅
- Dashboard menunjukkan probabilitas breakout bearish > 60% 📊
❌ Jangan Trading Jika...
- Lilin berwarna abu-abu (tidak ada bias yang jelas) ⚪
- Sebuah sinyal "PEMBALIKAN" muncul tepat saat Anda akan masuk ⚠️
- Harga berada di dalam rentang biru tanpa breakout yang jelas 🔵
- Dashboard menunjukkan konfluensi berlawanan (konfluensi bearish pada setup bullish, atau sebaliknya) 🔄
📈 Interpretasi Dashboard
teks
═══ SMART MONEY PRO ═══
Bias: BULLISH ▲ ← Bias pasar saat ini
Zona Bull: 2 Bear: 1 ← Zona likuiditas aktif
Aliran Cont: 3 Rev: 0 ← Lanjutan vs pembalikan
Rentang: 4 (aktif: 1) ← Total dan rentang aktif
Rentang Aktif ▲65% ▼35% ← Probabilitas breakout
⚡ KONFLUENSI BULLISH ← Sinyal penyelarasan maksimum
💡 Prinsip Utama
- ✅ Tidak ada repaint: semuanya dihitung menggunakan data bar yang sudah tertutup saja.
- ✅ Grafik bersih: lilin asli berwarna, zona semi-transparan, tanpa kekacauan visual.
- ✅ Pratinjau struktur: warna lilin memberi tahu Anda fase pasar sebelum pivot terlihat jelas.
- ✅ Konfluensi bawaan: ketika zona aktif + rentang aktif + sinyal aliran semua selaras, dashboard secara eksplisit menandainya untuk Anda.
Ringkasan
Key features include:
- **Institutional Flows:** Draws horizontal lines and colored boxes between significant pivots, labeling flows as "CONTINUATION" or "REVERSAL" to indicate trend respect or break.
- **Supply and Demand Zones:** Highlights unexecuted institutional orders with horizontal bands around pivots, distinguishing supply (sell) and demand (buy) zones that expire or break upon price penetration.
- **Range Detection:** Identifies consolidation ranges using an SMA with ATR bands, marking them with blue rectangles and providing breakout probability percentages based on momentum, volume, and time distribution.
- **Dashboard:** Displays numeric summaries of active zones, flows, ranges, and breakout probabilities, including confluence signals when multiple factors align.
Recommended for use on H1 or higher timeframes, the indicator suits Forex, indices, and cryptocurrencies. It operates without repainting by relying on closed bar data and maintains a clean chart presentation with visible candle wicks and bodies.
Ulasan pelanggan
5 | 50 % | |
4 | 0 % | |
3 | 0 % | |
2 | 50 % | |
1 | 0 % |


![Logo "[Hamster-Coder] Bollinger Bands"](https://cdn.ctrader.com/image/webp/21d8e5d6-fb11-4bac-b9ee-cd05c2b76804_30327)


