
Daily SD Levels - Indicator
Indikator
4 pembelian
Versi 1.0, Aug 2025
Windows, Mac
5.0
Ulasan: 1
Deskripsi
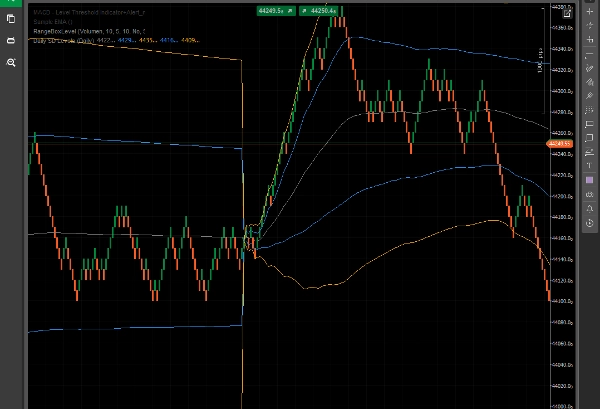
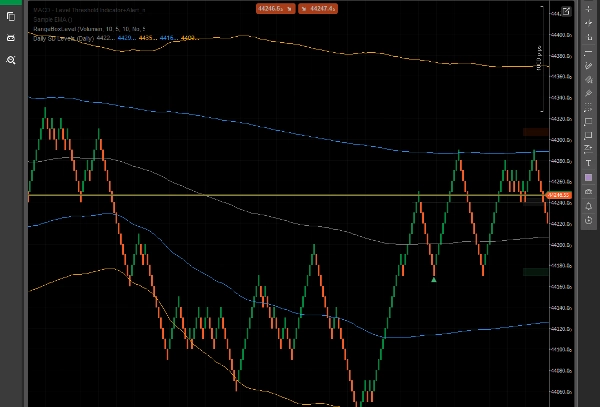
Level SD Harian – Pita Deviasi Standar Dinamis Berbasis VWAP
Indikator Level SD Harian menggambarkan VWAP (Harga Rata-rata Tertimbang Volume) dan Pita Deviasi Standar (+1/+2 dan -1/-2) yang dihitung selama hari perdagangan saat ini.
Alat ini membantu para trader menilai volatilitas intraday secara visual, potensi zona support/resistance, dan ekstrem harga, semuanya berdasarkan volume pasar dan aksi harga aktual – bukan level tetap atau sewenang-wenang.
Fitur Utama:
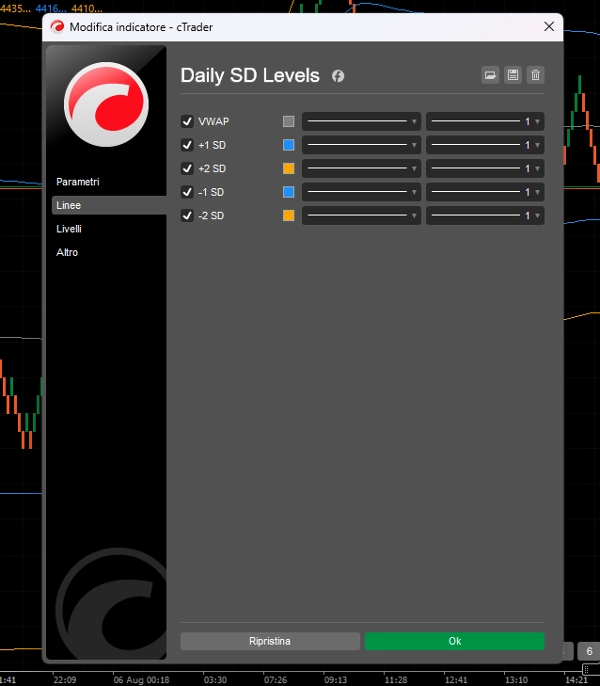
- Garis VWAP untuk pelacakan nilai wajar intraday.
- Pita SD +1/+2 dan -1/-2 untuk mengidentifikasi zona jenuh beli/jenuh jual.
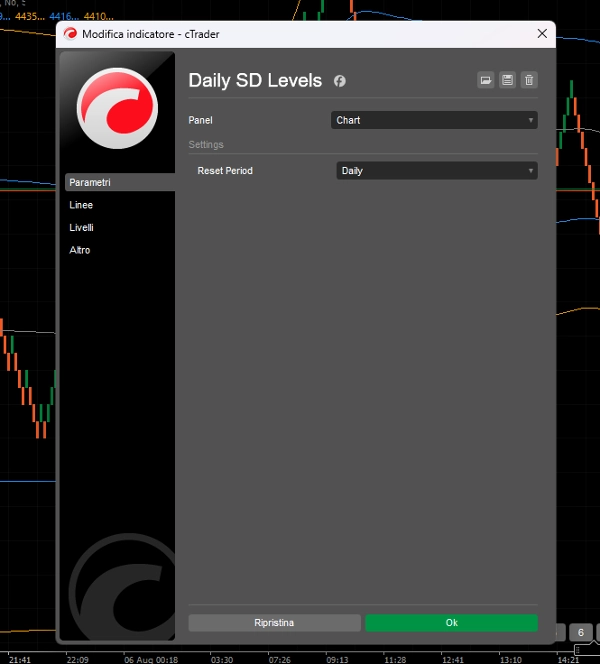
- Level direset setiap hari, menyesuaikan dengan dinamika harga dan volume setiap sesi.
- Dioptimalkan untuk Renko, Range Bar, dan Perdagangan Intraday.
- Dibuat untuk trader yang membutuhkan kejelasan dan zona harga dinamis.
Indikator ini sempurna untuk:
- Setup mean reversion.
- Mengidentifikasi pergerakan yang melampaui batas untuk kemungkinan pembalikan.
- Konfirmasi visual dari breakout melewati batas statistik.
Tanpa kekacauan. Hanya level bersih dan responsif yang bergerak bersama pasar.
Ringkasan
Profil indikator
Ulasan pelanggan
5.0
Ulasan: 1
5 | 100 % | |
4 | 0 % | |
3 | 0 % | |
2 | 0 % | |
1 | 0 % |
Ulasan pelanggan
August 8, 2025
it gives context without making the decision, but the chart still needs a human read.
Diskusi
Pertanyaan umum
Produk-produk yang tersedia melalui cTrader Store, termasuk bot trading, indikator, dan plugin, disediakan oleh pengembang pihak ketiga serta hanya ditujukan untuk akses teknis dan informasi. cTrader Store bukan broker dan tidak menyediakan saran investasi, rekomendasi pribadi, atau jaminan apa pun tentang kinerja di masa mendatang.


Harga
Sejak 16/07/2025
5
Penjualan