
JMA-Like
Chỉ báo
1 lượt mua
Phiên bản 1.0, Aug 2025
Windows, Mac
5.0
Đánh giá: 1
Mô tả
JMA-Like – Trung bình động không trễ thích ứng
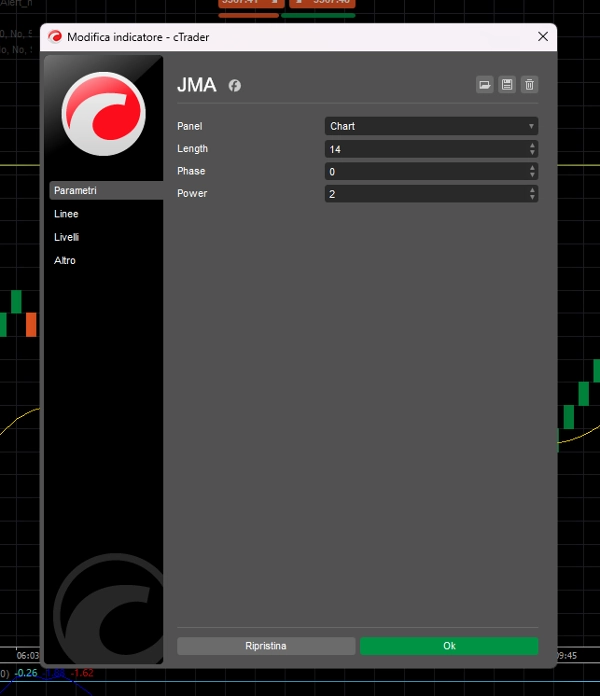
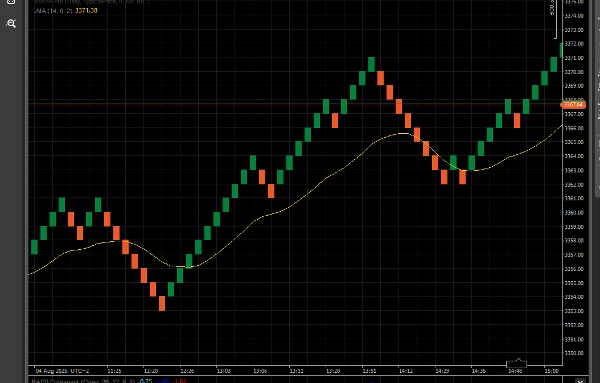
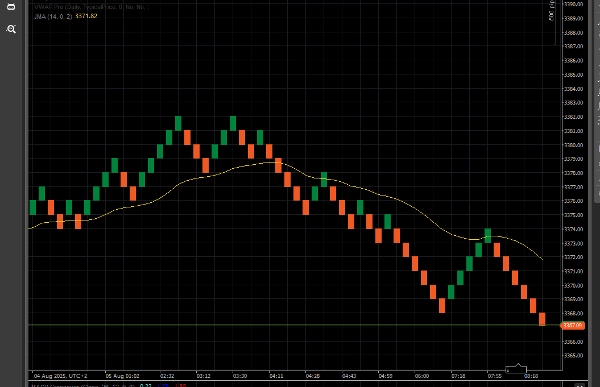
JMA Advanced là một trung bình động phản hồi cao và cực kỳ mượt mà được thiết kế để mô phỏng hành vi của Jurik Moving Average (JMA) gốc. Nó thích ứng động với biến động thị trường, giảm độ trễ đồng thời lọc bỏ nhiễu.
Được xây dựng với các thuật toán làm mượt tiên tiến, JMA Advanced hoàn hảo cho cả chiến lược theo xu hướng và ngược xu hướng. Nó bao gồm các tham số điều chỉnh Phase và Power để kiểm soát độ nhạy và vượt mức, làm cho nó lý tưởng cho các nhà giao dịch Renko, phạm vi và hành động giá.
✅ Cảm giác không trễ
✅ Thích ứng với biến động
✅ Hoạt động trên tất cả các khung thời gian và loại biểu đồ
✅ Hoàn toàn tùy chỉnh được
Tóm tắt
Tóm tắt AI
JMA-Like is an adaptive zero-lag moving average indicator designed to replicate the behavior of the original Jurik Moving Average (JMA). It features advanced smoothing algorithms that dynamically adjust to market volatility, reducing lag while filtering out noise. The indicator includes customizable Phase and Power parameters, allowing users to control responsiveness and overshoot. It is suitable for various trading styles, including trend-following and contrarian strategies, and works effectively on all timeframes and chart types such as Renko, range, and price action charts. Key features include a zero-lag feel, volatility adaptation, and full customization options.
Hồ sơ chỉ báo
Đánh giá của khách hàng
5.0
Đánh giá: 1
5 | 100 % | |
4 | 0 % | |
3 | 0 % | |
2 | 0 % | |
1 | 0 % |
Đánh giá của khách hàng
Thảo luận
Câu hỏi thường gặp
Các sản phẩm có sẵn trên cTrader Store, bao gồm bot giao dịch, chỉ báo và plugin, được cung cấp bởi các nhà phát triển bên thứ ba và chỉ nhằm mục đích cung cấp thông tin và tiếp cận kỹ thuật. cTrader Store không phải là nhà môi giới và không cung cấp lời khuyên đầu tư, khuyến nghị cá nhân hay bất kỳ đảm bảo nào về hiệu suất trong tương lai.
Sản phẩm khác của tác giả này


Giá
Kể từ 16/07/2025
5
Lượt bán