
Описание
Этот индикатор предназначен для выполнения множественного нелинейного регрессионного анализа с использованием четырёх независимых переменных: цены закрытия, открытия, максимума и минимума.
Вот компоненты и функциональные возможности:
Входные данные:
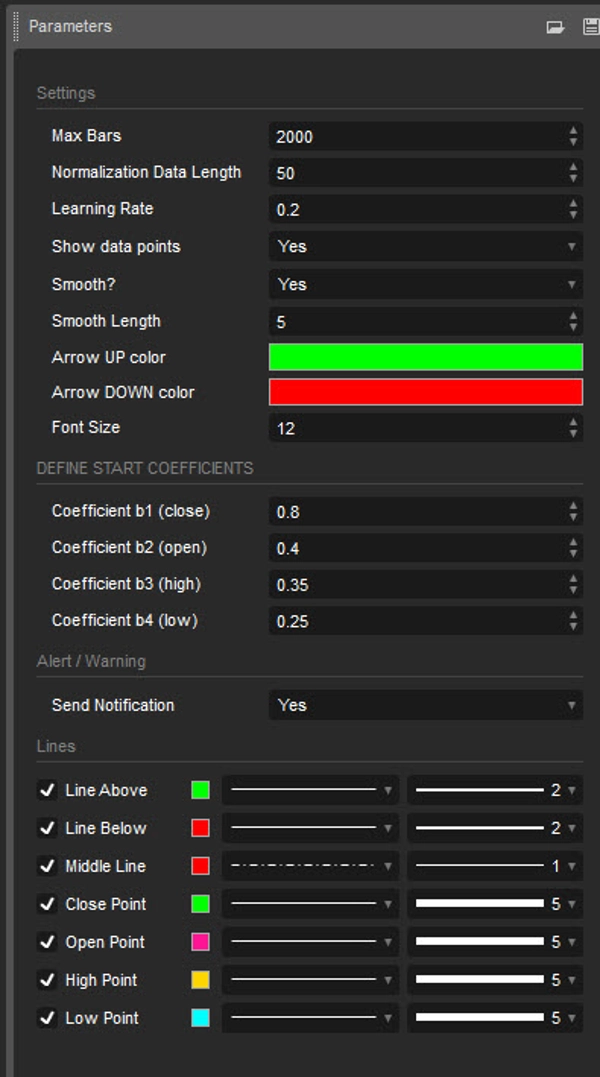
- Длина данных для нормализации: Длина данных, используемых для нормализации.
- Скорость обучения: Скорость, с которой алгоритм учится на ошибках.
- Показать точки данных: Показать построение нормализованных входных данных (close, open, high, low)
- Сглаживание?: Опция сглаживания вывода.
- Длина сглаживания: Длина сглаживания, если включено.
- Определить начальные коэффициенты: Начальные коэффициенты для уравнения регрессии.
Нормализация данных:
Скрипт нормализует входные данные в диапазоне от 0 до 1, используя максимальные и минимальные значения в пределах заданной длины.
Нелинейная регрессия:
Он вычисляет уравнение регрессии, используя входные коэффициенты и нормализованные данные. Используемое уравнение представляет собой взвешенную сумму независимых переменных, при этом коэффициенты корректируются итеративно с помощью градиентного спуска для минимизации ошибок.
Вычисление ошибки:
Скрипт вычисляет ошибку между фактическими и предсказанными значениями.
Градиентный спуск:
Коэффициенты обновляются итеративно с помощью градиентного спуска для минимизации ошибки.
Визуализация:
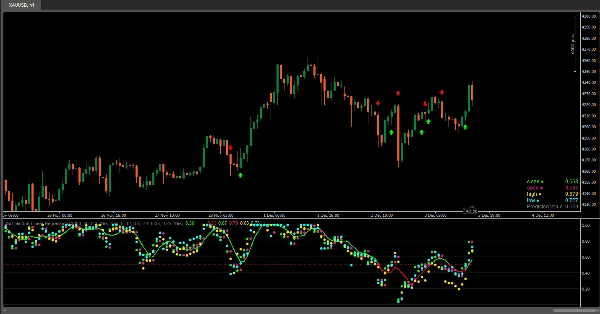
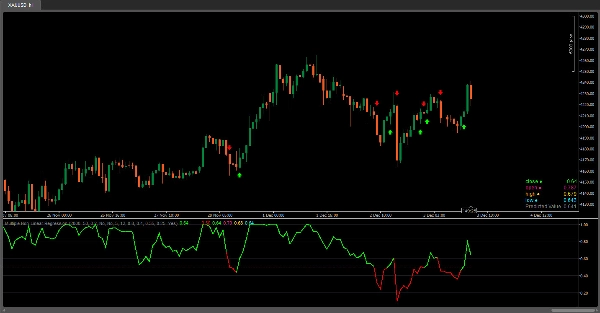
- Построение нормализованных входных данных (close, open, high, low).
- Индикатор предоставляет визуализацию нормализованных значений данных (close, open, high, low) в виде круглых маркеров на графике, позволяя пользователям легко наблюдать относительные положения этих значений друг относительно друга и линии регрессии.
- Построение линии регрессии.
- Цветовой градиент на линии регрессии в зависимости от её значения и цвета баров.
- Отображение нормализованных входных данных и предсказанного значения в таблице.
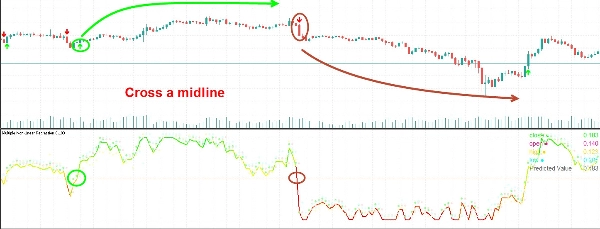
- Сигналы для пересечений с средней линией (0.5).
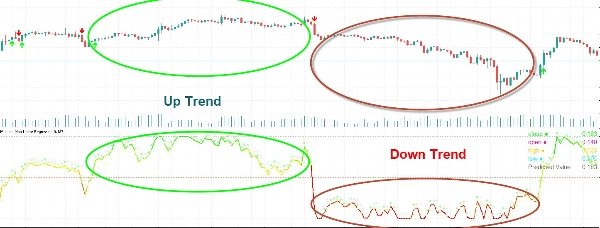
Интерпретация:
Пользователи могут интерпретировать линию регрессии и её пересечения с средней линией (0.5) как сигналы потенциальных возможностей для покупки или продажи.
Этот индикатор помогает пользователям анализировать взаимосвязь между несколькими переменными и принимать торговые решения на основе регрессионного анализа. Настройка коэффициентов и параметров позволяет тонко настроить производительность модели в соответствии с конкретными рыночными условиями.
Сводка
Отзывы покупателей
5 | 100 % | |
4 | 0 % | |
3 | 0 % | |
2 | 0 % | |
1 | 0 % |


