
Описание
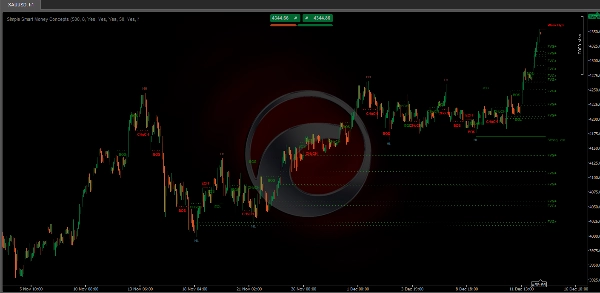
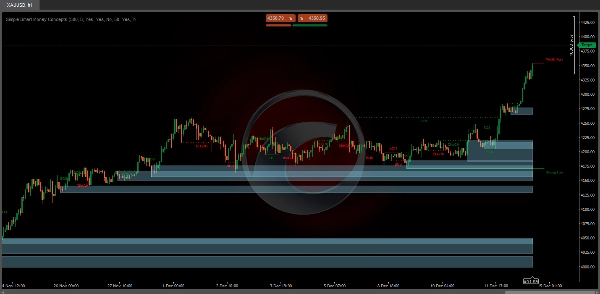
Этот индикатор Simple Smart Money Concepts отображает структуру рынка в реальном времени (внутренний и swing BOS / CHoCH), блоки ордеров, зоны премиум и скидок, равные максимумы и минимумы и многое другое... позволяя трейдерам автоматически отмечать свои графики с помощью широко используемых методологий price action.
"Smart Money Concepts" (SMC) — это термин, используемый трейдерами price action, стремящимися точнее ориентироваться в ликвидности и находить более оптимальные точки интереса на рынке. Попытка определить, где институциональные участники рынка разместили ордера, может быть очень разумным подходом к поиску более практичных входов и выходов на основе price action.
Ключевые особенности
- Внутренняя и Swing структура рынка в реальном времени:
-
- Внутренние структуры: Эти элементы относятся к ценовым формированиям и паттернам, которые происходят в меньшем масштабе или в конкретной торговой сессии. Набор может обнаруживать тонкие детали, такие как мелкие уровни поддержки/сопротивления или краткосрочные развороты тренда.
- Внешние структуры: Они включают более крупные, значимые рыночные паттерны и тренды, охватывающие несколько сессий или таймфреймов. Эта возможность помогает трейдерам понимать общие направления рынка.
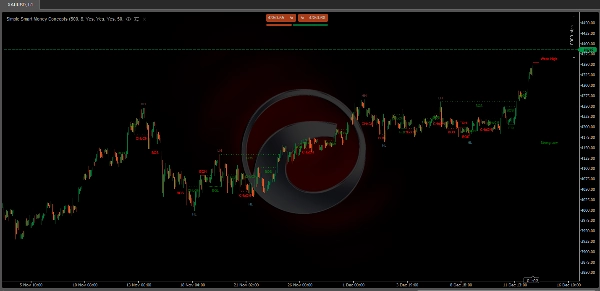
- Области HH/LH/LL/LH:
-
- Определение Higher Highs (HH), Lower Highs (LH), Lower Lows (LL) и Lower Highs (LH) помогает понять тренд и структуру рынка, способствуя прогнозному анализу.
- Break of Structure (BOS):
-
- Эта функция определяет точки, где цена пробивает значимую структуру, что может указывать на новый тренд или разворот тренда.
- Change of Character (CHoCH):
-
- Обнаруживает тонкие изменения в поведении рынка, которые могут указывать на ранние стадии изменения тренда до того, как они станут очевидны для широкой публики.
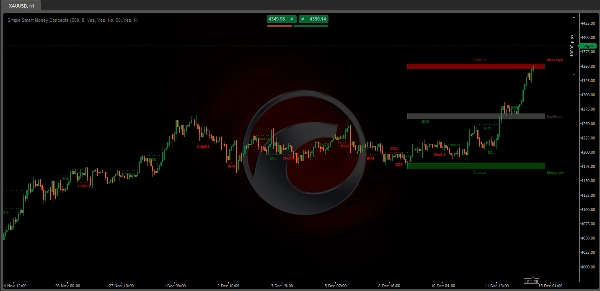
- Order Blocks:
-
- Это, по сути, ценовые уровни или зоны, где ранее происходила значительная торговая активность, вероятно указывающая на позиции умных денег.
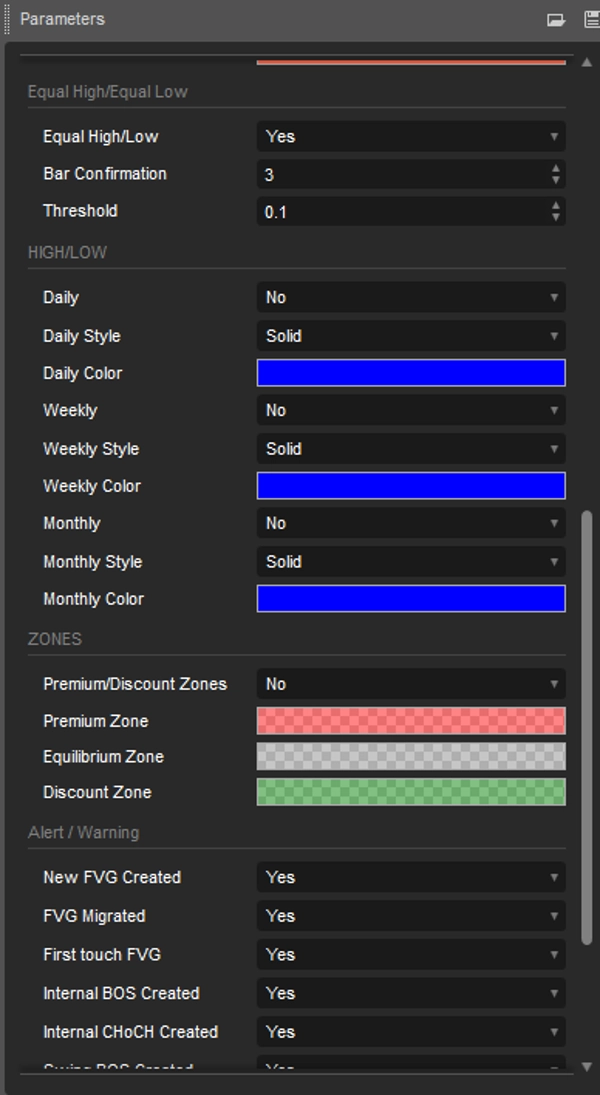
- Равные максимумы и минимумы
-
- Отображает метки EQH/EQL на графике для обнаружения равных максимумов и минимумов.
- Fair Value Gaps:
-
- Fair Value Gaps: Формирование из трех свечей, где тени свечей, прилегающих к центральной, не перекрываются, что выделяет область гэпа.
- Предыдущие максимумы и минимумы:
-
- Позволяет пользователю отображать предыдущие максимумы и минимумы с дневных, недельных и месячных таймфреймов как значимые уровни
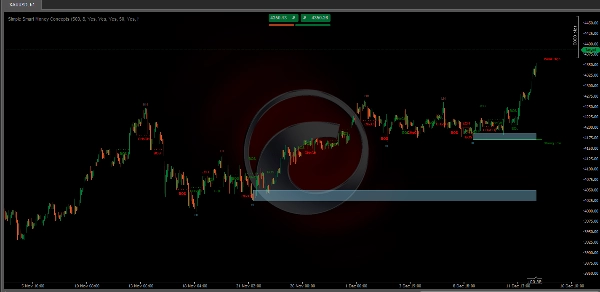
- Зоны премиум и скидок в виде диапазона:
-
- Позволяет пользователю отображать зоны Premium, Discount и Equilibrium на графике
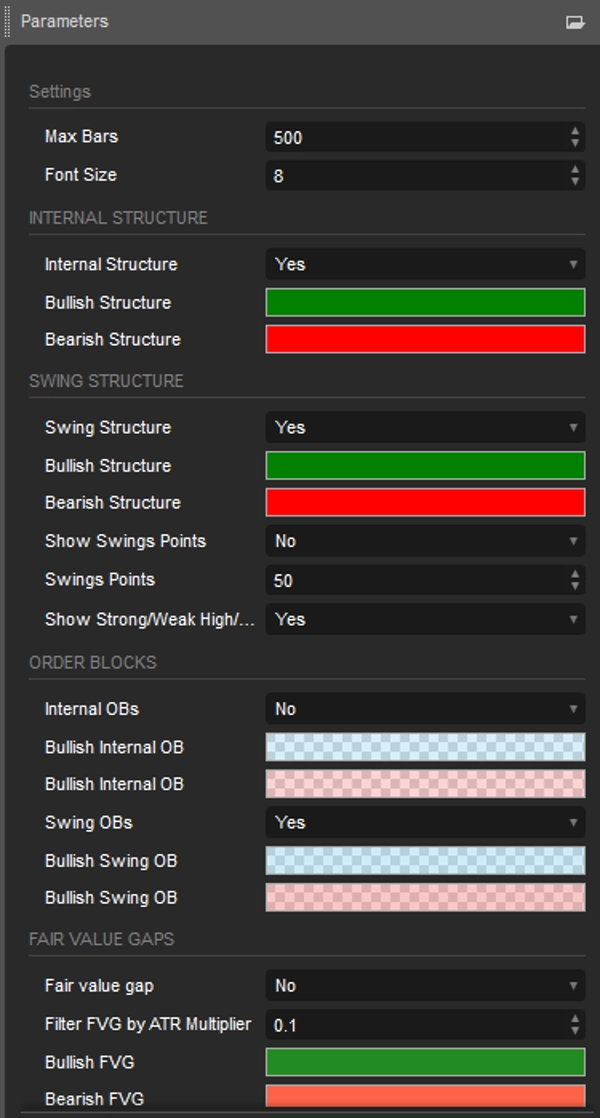
Настраиваемые функции
- Пользователи могут настраивать параметры, такие как длина данных, цвета и стили отображения, чтобы соответствовать своим торговым предпочтениям.
Преимущества для трейдеров
- Экономит время на ручном анализе, повышая эффективность торговли.
- Помогает принимать быстрые и обоснованные решения в условиях волатильного рынка.
- Прост в использовании как для новичков, так и для опытных трейдеров.
Заключение
Индикатор Simple Smart Money Concepts — это не просто инструмент, а комплексное решение для трейдеров, стремящихся эффективно применять стратегии ICT. Это надежный выбор для улучшения анализа рынка и точного исполнения сделок.
Сводка
Additional features include the identification of equal highs and lows, fair value gaps (three-candle formations indicating price gaps), and previous highs and lows across daily, weekly, and monthly timeframes. It also displays premium, discount, and equilibrium zones to help traders assess value areas.
Users can customize settings such as data length, colors, and display styles to fit their trading preferences. The indicator supports analysis across multiple markets including Forex, cryptocurrencies (e.g., BTCUSD), stocks, and commodities (e.g., XAUUSD).
Designed to streamline chart analysis, the Simple Smart Money Concepts indicator aids traders in making informed decisions by visually representing widely used price action methodologies and institutional order flow concepts.
Отзывы покупателей
5 | 33 % | |
4 | 67 % | |
3 | 0 % | |
2 | 0 % | |
1 | 0 % |


