

説明
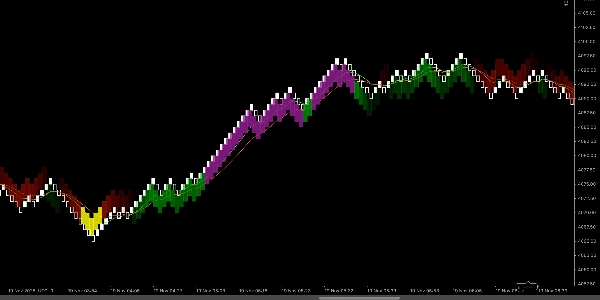
レンコEMAスキャルパーゾーンは、cTraderプラットフォーム上のレンコ100ピップチャート専用に構築された軽量で視覚的なスキャルパーインジケーターです。2つの指数移動平均線(EMA)を使用して短期のトレンド方向を特定し、クリーンで取引可能なゾーンを強調表示します。インジケーターはチャート上に4色の塗りつぶし長方形を描画し、スキャルパーが市場のバイアスを即座に読み取り、手動での数値計算なしに高確率のエントリーを見つけられるようにします。
各色の意味
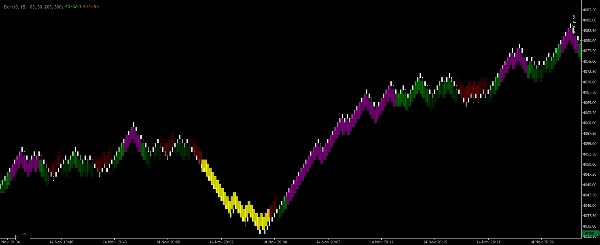
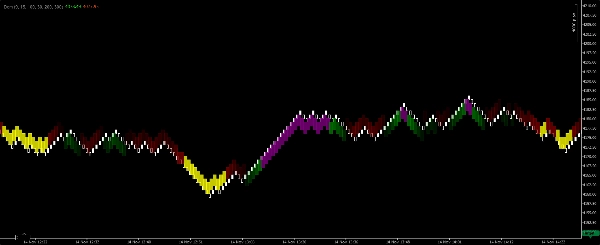
- 緑の長方形 — 強気トレンドが確認されました。速いEMAが遅いEMAの上にあり、EMAは上向きに配置されています。短期のトレンドフォローのロングに使用してください。
- 紫の長方形 — 強気の文脈内の買いエントリーゾーン。活発な強気トレンド内の短期的なプルバックまたは調整を示し、スキャルピングのエントリー機会を提供する可能性があります。
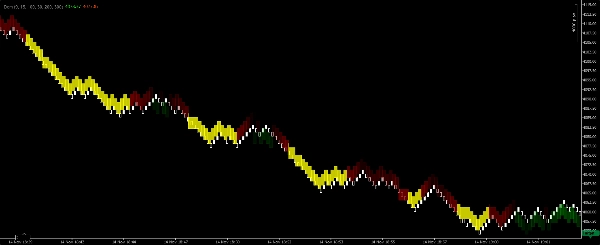
- 赤の長方形 — 弱気トレンドが確認されました。速いEMAが遅いEMAの下にあり、EMAは下向きに配置されています。短期のトレンドフォローのショートに使用してください。
- 黄色の長方形 — 弱気の文脈内の売りエントリーゾーン。活発な弱気トレンド内の短期的なプルバックまたは調整を示し、スキャルピングのエントリー機会を提供する可能性があります。
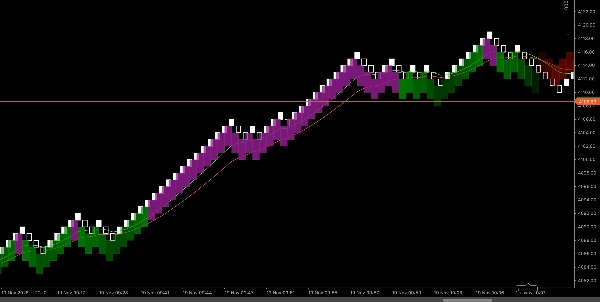
動作の仕組み(ロジックの概要)
- インジケーターはレンコ100ピップチャート上で2つのEMA(速いEMAと遅いEMA)を計算し、それらの相対的な配置と傾きを評価してトレンド方向を判断します。
- EMAが明確な強気の配置と勢いを示すとき、インジケーターはトレンド領域をまたぐ緑色の長方形を描画します。その強気領域内に短期の調整やプルバックが現れた場合、インジケーターは買いエントリーの機会を示す紫色の長方形を描画します。
- 同じロジックが弱気条件に逆適用され、赤色(トレンド)と黄色(エントリー)の長方形を生成します。
- 長方形はゾーンとして描画され(単一バーではなく)、スキャルパーが迅速なエントリーとエグジットのタイミングを視覚的に評価できるようにします。
推奨設定(スキャルパーのデフォルト)
- チャートタイプ:レンコ
- レンコブリックサイズ: 100ピップ(このブリックサイズ用に設計されたインジケーター)。
- 感度/検出 — インジケーターがトレンド長方形を描画する前にEMAの整列をどれだけ厳密に要求するかを調整するパラメーター(低いほどシグナルが多く、高いほどシグナルは少なく強くなります)。
- 長方形の不透明度 — 価格バー上での視覚的な明瞭さを調整します。
- セッションフィルター — スキャルピングに適した高流動性時間帯に制限することを推奨します。
- 最大ゾーン幅(バー数) — ゾーンが過度に伸びるのを防ぐための任意の制限。
使用ガイダンス&スキャルパールール
- 緑/赤の長方形をトレンド確認として扱います。色付きのトレンドゾーンの方向に沿って取引することを優先し、トレンド長方形が支配的な場合は積極的な逆張りスキャルピングを避けてください。
- 紫/黄色の長方形を、確認されたトレンド内のスキャルピングエントリーウィンドウとして使用します。エントリー前に迅速なマイクロ構造のトリガー(例:モメンタムバー、小さな調整のブレイクアウト)を探してください。
- ターゲットはスキャルピングに適したタイトで現実的なものにしてください(ストップの小さな倍数)。リスクプロファイルに応じて固定ピップターゲットまたは最小バー確認を使用します。
- ストップは最近のマイクロ構造の安値/高値の外側またはエントリーゾーンの外に置いてください。スキャルピングには規律ある小さな損失が必要です。
- ボリューム/プライスアクションの確認(利用可能な場合)と組み合わせ、活発なセッション中のみ取引してください。
- ご自身の銘柄で視覚的にバックテストしてください。レンコ100ピップは、100ピップのブリックがスキャルピングに有用な価格構造を生み出すボラティリティの高い通貨ペアや銘柄に適しています。
概要
インジケーターのプロフィール
カスタマーレビュー
4.2
レビュー: 4
5 | 50 % | |
4 | 25 % | |
3 | 25 % | |
2 | 0 % | |
1 | 0 % |
カスタマーレビュー
November 25, 2025
A decent setup here should survive 50 quick trades without looking messy. A few sessions of data make the result easier to trust. The useful comparison is hit rate versus average R.
November 18, 2025
The product feels more useful when the plan is already written down. A 13 setup run on daily close keeps the review grounded.
November 18, 2025
This feels useful when you already has a plan. The main value is short term execution, not chasing every signal that appears. Early sizing should stay modest until the journal looks stable.
November 18, 2025
Useful tool, but not for lazy entries. It supports short term execution and feels more useful if the trader stays selective.
ディスカッション
よくあるご質問
BTCUSD
Forex
Signal
Scalping
Commodities
Crypto
XAUUSD
cTrader Storeで入手可能な取引ボット、インジケーター、プラグインなどの商品は、第三者の開発者が提供するものであり、情報と技術の取得のみを目的としてご利用いただけます。cTrader Storeはブローカーではなく、投資助言や個人的な推奨を行うことも、将来のパフォーマンスを保証することもありません。
この作成者の他の商品


価格
登録日 14/03/2025
23
販売