
説明
新しいトレーダーが犯しがちな最大の間違いの一つは、あまりにも多くのインジケーターを追加してチャートにできるだけ多くの情報を詰め込もうとすることで、その結果、ノイズでいっぱいのチャートになり、線やデータが混在してトレーダーに矛盾した情報を与えてしまうことです。
長所:
- 反転を検出する際の驚異的な精度。
- 視覚的に見やすく、市場状況が把握しやすい。
- トレンド取引インジケーターとしても、逆トレンド取引インジケーターとしても使用可能。
- 強力なバックテスト結果(Extremeシグナルで約95%の精度)。
短所:
- 買われ過ぎの「Extreme」や売られ過ぎの「Extreme」条件でも、非常に強いトレンドの逆方向に取引をしてしまい、価格が最終的に反転する前に大きなドローダウンを引き起こすことがあります。
- 15分足以上の時間軸で取引する場合、買われ過ぎ「Extreme」や売られ過ぎ「Extreme」シグナルは稀になることがあります。これを補うために、少なくとも8つの主要通貨ペアで取引して頻繁にExtremeシグナルを受け取ることを推奨します。
Chaos Reversalsの使い方
Chaosを使ったシンプルで勝てるシステムは、週次および日次のサポートとレジスタンスラインをマークし、15分足のChaosの買われ過ぎExtremeおよび売られ過ぎExtremeシグナルを使って、それらのサポート・レジスタンスラインからの反発を逆トレンドで取引する方法です。
シグナルは以下のように生成されます:
- 高速W%Rが最初に動き、その後に低速W%Rが続きます。
- 単一の高速W%Rが売られ過ぎまたは買われ過ぎの場合、これらの反転をスキャルピングできます。
- 高速および低速W%Rの両方が売られ過ぎまたは買われ過ぎの場合、市場が大幅に反転することを示します。
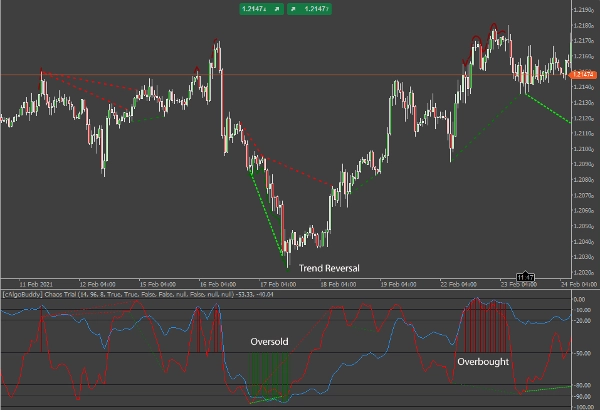
インジケーターは価格チャートの安値または高値に赤または緑の線を描画し、インジケーター領域にも買われ過ぎまたは売られ過ぎの極端な状態を示す赤または緑の線を描きます。これはインジケーターのオプションで無効にできます。
ダイバージェンスの見つけ方
W%Rはオシレーターであるため、ダイバージェンスを見つけて取引する機会を提供します。主に2種類のダイバージェンスがあります:レギュラーと隠れたです。
- レギュラーダイバージェンスは価格方向の反転の兆候です。
- 隠れたダイバージェンスは価格方向の継続の兆候です。
各主要タイプの中に、二次分類があります:ベアリッシュ(ネガティブ)とブルリッシュ(ポジティブ)です。
- ベアリッシュダイバージェンスは、インジケーターが下落する一方で価格が上昇または横ばいになると発生します。
- ブルリッシュダイバージェンスは、インジケーターが上昇する一方で価格が下落または横ばいになると発生します。
レギュラーダイバージェンス
レギュラーダイバージェンスを簡単に言うと:
- 価格が高値を更新しているのに対し、W%Rの高速ラインが低い高値を作っている:ショートの可能性。
- 価格が安値を更新しているのに対し、W%Rの高速ラインが高い安値を作っている:ロングの可能性。
どちらの場合も、トレーダーは価格の反転の可能性を探ります。
レギュラーダイバージェンスは、現在のスイング高値またはスイング安値と直前のスイング高値またはスイング安値を比較する際に最も効果的です。レギュラーダイバージェンスでは、トレンドが弱まり、市場のセンチメントが反対方向に変化しています。トレーダーは有利な反転や戻りを取引する準備ができます。
Chaos Reversalsでは、レギュラーダイバージェンスは以下のように表示されます:
- ブルリッシュレギュラーダイバージェンス – 明るい緑の細い破線。
- ベアリッシュレギュラーダイバージェンス – 赤の細い破線。
注意:ダイバージェンスラインは、確認されたダイバージェンスの次のバーの始値で表示されます。
隠れたダイバージェンス
隠れたダイバージェンスを簡単に言うと:
- 高速W%Rラインが低い安値を作っているのに対し、価格は高い安値を作っている:ロングの可能性。
- 高速W%Rラインが高い高値を作っているのに対し、価格は低い高値を作っている:ショートの可能性。
どちらの場合も、トレーダーは価格の継続の可能性を探ります。
隠れたダイバージェンスは、現在のトレンドに関連する価格を評価するのに最適です。プルバックの後、価格はしばしばトレンド方向に向かって最後のスイング高値またはスイング安値のレベルに向かって継続します。隠れたダイバージェンスでは、トレンドは弱まっているかもしれませんが、まだ完了していません。以下に示すように、市場はおそらく利益確定のためにプルバックし、下降トレンドを再開しようとしています。
Chaos Reversalsでは、隠れたダイバージェンスは以下のように表示されます:
- ベアリッシュ隠れたダイバージェンス – 緑の広い破線。
- ブルリッシュ隠れたダイバージェンス – 濃い赤の広い破線。
ダイバージェンスを使った取引
ダイバージェンスを使った取引には注意が必要です。市場がダイバージェンスシグナルの方向に動かない場合もあることを認識してください。ダイバージェンスは市場方向の潜在的な変化または継続の指標であることを理解することが重要です。市場方向を確認するために価格の動きを監視することが重要です。また、Chaosインジケーターの全体的な方向も、インジケーターラインとレベル(買われ過ぎの極端は0、売られ過ぎの極端は-100)を比較して確認してください。
アラートと通知
送信されるシグナルは、Extremeの買われ過ぎ/売られ過ぎの開始と終了、極端な位置での低速W%Rのピーク、およびすべてのダイバージェンスです。
Telegramアラート
Telegramでボットとチャンネルを設定している場合、Chaos Reversalsインジケーターは通貨ペアの確認済みシグナルのメッセージを送信します。
重要:
アプリケーションの右下隅にあるローカル時間に合わせてタイムゾーンが正しく設定されていることを必ず確認してください。
デスクトップアラート
「はい」を選択すると、Chaos Reversalsインジケーターは確認済みシグナルのメッセージボックス通知を個人のデスクトップにプッシュします。
メールアラート
この機能を使用するには、まずcTraderの設定でメール送信ができるように構成する必要があります(設定-> メール)。
概要
カスタマーレビュー
5 | 100 % | |
4 | 0 % | |
3 | 0 % | |
2 | 0 % | |
1 | 0 % |


