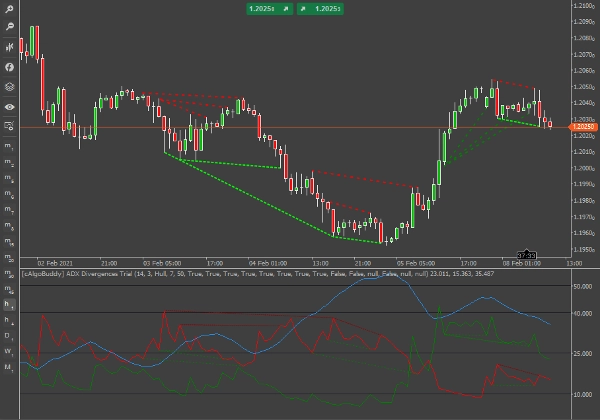
「cAlgoBuddy - ADX Divergences」ロゴ
インジケーター
バージョン 1.0、Jan 2025
Windows、Mac
5.0
レビュー: 2
「cAlgoBuddy - ADX Divergences」アップロード画像
11
販売

Introduction to ADX

ADX (blue line) is plotted as a single line with values ranging from a low of zero to a high of 100. ADX is non-directional; it registers trend strength whether the price is trending up or down. The indicator is usually plotted in the same window as the two directional movement indicator (Di+ and Di-) lines, from which ADX is derived.

This indicator spots divergences on Di+ and Di- lines. In contrast to other indicators that spot divergences, with this one, we can extract more valuable information from the other 2 counterparts of a divergence signal. For example, if a divergence happens on Di+, we can evaluate the signal taking into account the Di- and ADX levels.

The Di+ and Di- lines are partially smoothed with a Hull moving average on 3 periods. For a 100% divergence frenzy, you can set the MA period to 1 and the moving average type to Simple. However, since we draw divergences on 2 lines in the same indicator window, sometimes you might feel overwhelmed by the signals. On the other hand, you can select from the indicator settings exactly which types of divergences you want to see and for which line (Di+ or Di-).


A divergence signal is considered confirmed at the opening of the bar following a divergence. However, due to the “inflexible” nature of the ADX trend lines (in comparison to, let’s say RSI) whenever a divergence line appears, it will probably stay there until the confirmation bar, unless extreme volatility occurs.


Before trading any divergence signal, identify the following:

  1. Direction and level of ADX
  2. Distance between Di+ and Di-
  3. Direction and level of Di+
  4. Direction and level of Di-


Also, keep in mind

  1. Avoid taking any divergence trade when the ADX is low (lower than 15 and falling trend), as the signals should be taken based on already developed or developing trends.
  2. Also, keep in mind that the crossing of Di+ and Di- is considered a bullish/bearish signal in itself, so modify your positions accordingly.
  3. In case both Di+ and Di- diverge on the same candle, choose the better corresponding line depending on the trend (Bullish trend/bullish signal Di+, Bearish trend/bearish signal Di-).
  4. You don’t have to trade every signal.


Divergences on DiPlus

DiPlus (Green) is the line that plots the bullish trend strength. We can spot divergences between the bullish trend strength in a similar way with most oscillators.


Regular Bullish Divergence

Definition: The price made a lower low but the indicator made a higher low. The ideal outcome is: After a minor bullish bump, we should see a bearish trend developing. Plotted with a dotted light green line in the price and indicator windows.


A dominant bearish trend that is starting to develop or is already developed. We go short after the small correction has happened. In some cases, the divergence on Di+ can happen on a bearish candle, a good confirmation of the dominant bearish trend.

Occasionally, the bullish bump will develop a bullish trend. This can happen when there is little to no trend (Di+ and Di- are close to each other, ADX< 20) or after bearish trend exhaustion on resistance levels.


Hidden Bullish Divergence

Definition: The price made a higher low and the indicator made a lower low. We should expect a bullish trend development or continuation. Plotted with a partially dotted dark green line in the price and indicator windows.


A dominant bullish trend that is starting to develop or is already developed. We go long after the small correction has happened. Stop-loss should be placed around the Low of the divergence candle.

One of the better signals of this indicator, mainly because we expect immediate trend continuation and we can keep our stop losses to a minimum.


Regular Bearish Divergence

Definition: The price made a higher high but the indicator made a lower high. After a minor bearish dip, we should see a bullish trend developing. Plotted with a dotted dark red line in the price and indicator windows.


A dominant bullish trend is still on the rise (ADX still rising on divergence time).

The circumstances for this scenario to happen are very rare since Di+ represents bullish strength. Usually, the circumstances will happen after the bullish trend has been exhausted, meaning that it is the final “peak” before the bearish trend will start to develop. So, most of the time it is recommended to go short on this signal.

Hidden Bearish Divergence

Definition: The price made a lower high and the indicator made a higher high. We should expect a bearish trend continuation. Plotted with a partially dotted red line in the price and indicator windows.


A dominant bearish trend with bullish spikes (ADX still rising on divergence time).

Asking for a bearish trend continuation from the bullish trend line is counterintuitive, this is why this signal should be taken very cautiously. Often, the market will enter a consolidation phase after this divergence.
In a trendless market, avoid taking a trade. In an exhausted bearish trend, if you choose to go short, scalp the trade.


Divergences on DiMinus


DiMinus (Red) is the line that plots the bearish trend strength. The way we spot divergences on price and DiMinus is somehow a reverse of the way we spot divergences on DiPlus.


Regular Bullish Divergence


Definition: The price made a lower low but the indicator made a lower high (instead of a higher low). After a minor bullish bump, we should see a bearish trend developing. Plotted with a dotted light green line in the price window and a dotted dark red line in the indicator window.


A dominant bearish trend that is starting to develop or is already developed. We go short after the small correction has happened. In some cases, the divergence on Di- can happen on a bearish candle, a good confirmation of the dominant bearish trend.

Just like the signal coming from the Di+ counterpart, sometimes the bearish bump will develop a bearish trend. This can happen when there is little to no trend (Di+ and Di- are close to each other, ADX< 20) or after bullish trend exhaustion on resistance levels.


Hidden Bullish Divergence


Definition: The price made a higher low and the indicator made a higher high (instead of a lower low). We should expect a bullish trend continuation. Plotted with a partially dotted green line in the price window and a partially dotted dark red line in the indicator window.

It’s counterintuitive to ask for a bullish trend continuation from the Di- trend line. We need to have bearish spikes in a bullish trend.


Regular Bearish Divergence


Definition: The price made a higher high but the indicator made a higher low (instead of a lower high). After a bearish dip in the price, we should see a bullish trend continuity. Plotted with a dotted dark red line in the price window and a dotted light green line in the indicator window.

It is recommended, in a strong and developing bullish trend to go long. But, in an exhausting and spent bullish market, go short.

Hidden Bearish Divergence


The price made a lower high and the indicator made a lower low (instead of a higher high). We should expect a bearish trend continuation. Plotted with a partially dotted red line in the price window and a partially dotted green line in the indicator window.


One of the better signals of this indicator, mainly because we expect immediate bearish trend continuation and we can keep our stop losses to a minimum. Stop-loss should be placed at the Low of the divergence candle.


Instant Telegram Message Alerts

Given that you have a bot and a channel set up in Telegram, the ADX Divergences indicator will send you messages for confirmed signals on the currency pair that you run it onto. Keep in mind that you will get signals only for the ones that you have selected "Yes" for display. You can configure this trading robot to also send instant Telegram alerts directly to your PC, Tablet or mobile phone.

IMPORTANT: Please make sure that your Time Zone is correctly adjusted to your local time (bottom right corner of the application). 


Desktop Alerts

If you select Yes, the ADX Divergences indicator will push a message box notification on confirmed signals on your personal desktop.


Email Alerts

For this functionality to work, you must first configure your cTrader to be able to send emails (Settings-> Email).  If you select Yes, the ADX Divergences indicator will send an email on confirmed signals to the address that you have entered.

インジケーターのプロフィール
5.0
レビュー: 2
5
100 %
4
0 %
3
0 %
2
0 %
1
0 %
カスタマーレビュー
February 4, 2025
It feels useful once there is another step before clicking in. Risk still needs respect.
January 29, 2025
BTCUSD
Forex
Signal
Breakout
Indices
Commodities
Stocks
XAUUSD
cTrader Storeで入手可能な取引ボット、インジケーター、プラグインなどの商品は、第三者の開発者が提供するものであり、情報と技術の取得のみを目的としてご利用いただけます。cTrader Storeはブローカーではなく、投資助言や個人的な推奨を行うことも、将来のパフォーマンスを保証することもありません。

この作成者の他の商品

インジケーター
Forex
Crypto
+6
The ultimate candlestick suite is here to help you detect most of the candlestick patters that exist today.
インジケーター
RSI
Forex
+10
All in One indicator designed to reveal Market Sentiment.
インジケーター
RSI
Forex
+6
What Constance Brown did with the RSI was to input a momentum calculation within the RSI itself. This the Composite RSI.
インジケーター
Forex
Crypto
+6
The cTrader Chaos Reversals indicator brings high-quality reversal signals to traders.
インジケーター
Forex
EURUSD
+3
The Zone Recovery indicator is used in an advanced hedging strategy, opening traders in the opposite direction.
インジケーター
ATR
Forex
+7
The purpose of the algorithm of the Boxify indicator is to try to put price action into zones, or better, boxes.

これも好きかも

インジケーター
AI
ATR
+27
The "Market Temperature" Moving Average -Turn Your MA Into a Live Market Temperature Line
インジケーター
ATR
RSI
+7
Visual tool tracking financial assets' % performance across timeframes, highlighting trends with color-coded insights.
インジケーター
Customizable window inside your platform, access to any website Calendar
インジケーター
ATR
RSI
+8
Multi-timeframe market-state dashboard: Score (-100..+100) + UP/NEUT/DN per TF, with optional closed-candle arrows.
インジケーター
Forex
BTCUSD
+12
Pro Structure Patterns Detector
インジケーター
RSI
Volume
+5
Multi-mode signal indicator with 3 filters, real-time bar-close detection, no repainting, and full alert system.
インジケーター
Prop
Forex
+12
Lightweight Risk-Reward Visualization Tool.
インジケーター
SMC
Prop
+13
Tracks virgin levels. Lines vanish only after a candle closes beyond the high/low on your chosen timeframe.
インジケーター
ATR
RSI
+14
A metric that can set 1 to 3 groups of Bollinger Bands
インジケーター
Conquer the markets with MA Sabres! This indicator spots trend flips with MAs and cool Sabre shapes & alerts.
インジケーター
EMA
RSI
+5
MACD Colour Histogram with 11 Moving Average Types, Multi-timeframe confirmation and Sound Signal Alert.
インジケーター
VWAP
NAS100
+5
Key NY session opens for NASDAQ (US100) & SP500 to find Tick Precise Entrys for High R:R intraday setups.
インジケーター
Key Levels
Market Structure
Economic calendar news directly on the chart.
インジケーター
Volume
Key Levels
+4
Session & Kill Zone Highlighter - Visual tool for London, NY, Tokyo, Sydney sessions plus ICT Kill Zones.
インジケーター
CCI
Volume
Monitor multiple pairs and timeframes with this interactive CCI dashboard. Includes mini-charts & Alerts.
インジケーター
Prop
Forex
+11
Ultimate Session Tool: Boxes, OR, KZs, PD Levels, Overlaps, Custom Lines & Names, Info Panel! Highly customizable 📉📈
インジケーター
Forex
Crypto
+1
Super Arrows
インジケーター
MACD
Key Levels
+2
Trend indicator with multi-timeframe filters, generating signals only on fully completed bricks & candles. No Repaint.
11
販売