
説明
Market Cipher Aは、暗号通貨市場のマクロトレンドの分析、識別、予測を容易にするために設計された高度なテクニカル指標です。
構造と構成要素
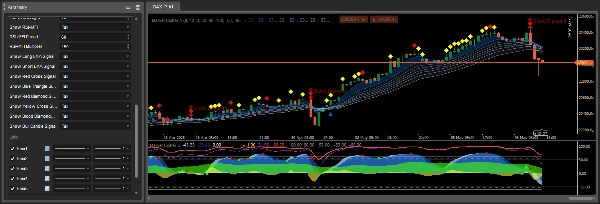
Market Cipher Aは、市場トレンドに応じて色が変わる8本の指数移動平均線(EMA)のリボンで構成されています。EMAリボンは強気市場では青または白に、弱気市場では灰色になります。
デフォルトでは、EMA値が5から34の移動平均線が使用されます。これらのラインのクロスオーバーは非常に強力な遅行指標となることがあり、そのためMarket Cipher Aは異なるシグナルに対応するシンボルを自動的に表示するようにプログラムされており、各強気または弱気のクロスオーバーを手動で解釈する必要を排除しています。
シンボルと取引シグナル
Market Cipher Aは、潜在的な取引機会を示す特徴的なシンボルをローソク足チャート上に直接表示します:
青い三角形 - トレンド反転のシグナルで、勢いの低下と反転の接近を示します。トレンドの勢いが減少していることを早期に警告します。
緑の円 - 強気の指標で、6時間足以上のタイムフレームで最も信頼性があります。通常、青い三角形の後に現れ、1~3本のローソク足の範囲内で解釈されるべきです。
黄色のダイヤモンド - 上昇トレンドの継続を示します。トレンド方向の確認を強化するためにEMAリボンと併用すべきです。
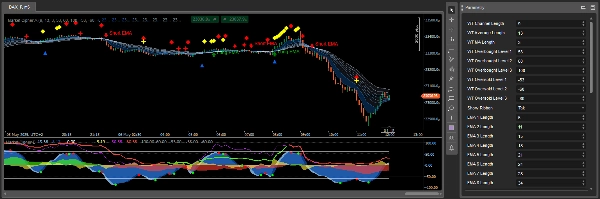
赤いダイヤモンド - トレンドの弱まりと下落継続の可能性を示します。下落の勢いが増していることを示唆します。
赤いX - 弱気の指標で、1時間足以上のタイムフレームで最も効果的です。EMAリボンと赤いダイヤモンドと併用すべきです。
黄色いX - 市場操作を示し、特に大きなロングポジションのカバーが短期ポジションによって素早く買われ売られることを示します。
大きな赤いダイヤモンド(ブラッドダイヤモンド) - 最も弱気なシグナルで、特に赤いXや小さな赤いダイヤモンドと一緒に現れると下落の高い確率を示します。
使用原則
Market Cipher Aは、強力な数学的サポートまたはレジスタンスを視覚的に提供し、取引環境を簡単に理解できるようにします。Heiken Ashiローソク足と組み合わせると最も効果的です。
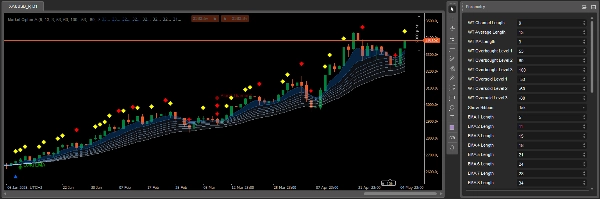
EMAリボンはトレンドを示すだけでなく、動的なサポートおよびレジスタンスレベルとしても機能します。リボンが青/白でローソク足がその上にある場合はロングポジションの機会を探し、リボンが灰色でローソク足がその下にある場合はショートポジションを検討できます。
Market Cipher AのシグナルをMarket Cipherパッケージの他の指標、特に追加のモメンタムシグナルとエントリーポイントを提供するMarket Cipher Bと組み合わせることで、最良の結果が得られます。
トレンドコンテキストにおける詳細なシグナル解釈
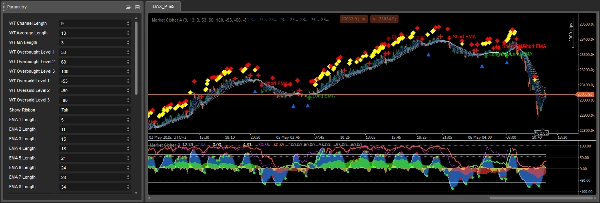
Market Cipher Aの重要な側面は、支配的なトレンドに応じたコンテキストでのシグナル解釈です。リボンが灰色から青に変わると、上昇トレンドの開始を示すシグナルとして緑の円が生成されます。通常、緑の円の後、次の1~3本のローソク足に黄色のダイヤモンドが表示されると、ブレイクアウトの確率が高くなります。ただし、赤いダイヤモンドが現れた場合はブレイクアウトの可能性は低くなります。
強気市場では、黄色のダイヤモンドはトレンドに沿った上昇継続を示し、赤いダイヤモンドは逆トレンドの動きを表します。弱気市場では状況が逆転し、赤いダイヤモンドは下落継続として好ましく、黄色のダイヤモンドはトレンドに反する一時的な上昇を示します。
赤いXは、赤いダイヤモンドの後に現れ、EMAリボンがほぼ完全に収縮して弱気の灰色に変わるときに最も信頼性があります。この指標の精度はタイムフレームによって異なります。
動作メカニズムとシグナルの生成
Market Cipher Aのシンボルとシグナルは、WaveTrend波のクロスオーバー、買われ過ぎ・売られ過ぎレベル、RSIおよびMFIが中心線を横切るか買われ過ぎ・売られ過ぎの状態に達したときに基づいて生成されます。この多次元分析により、シグナルは単一の指標よりも包括的になります。
EMAリボンは8本の移動平均線で構成され、個々のバンド間に特徴的なリボンを形成します。バンドの分離は重要な要素で、広い分離は強いトレンドを示し、収縮したバンドは勢いの弱まりや統合を示唆します。
取引戦略における実用的な応用
Market Cipher Aは主にトレンド分析ツールとして設計されているため、トレンドフォロー戦略で最も効果的に機能します。リボンを他のトレンド識別指標と併用し、価格の押し目で取引機会を探すことが推奨されます。
これらのシグナルはエントリーやエグジットのタイミングを微調整するのに役立ちますが、単独で取引判断に使用すべきではありません。特にフラットな価格変動中に発生する反転シグナルには追加の確認が必要です。
概要
The indicator automatically displays distinct symbols on the price chart to signal potential trading opportunities:
- Blue Triangle: signals declining momentum and possible trend reversal.
- Green Circle: indicates a bullish trend start, most reliable on 6-hour timeframes and above.
- Yellow Diamonds: suggest continuation of an upward trend.
- Red Diamonds: indicate trend weakening and potential downward continuation.
- Red X: bearish signal effective on 1-hour timeframes and higher.
- Yellow X: points to market manipulation events.
- Large Red Diamond ("Blood Diamond"): strong bearish signal with high probability of decline.
Signals are generated using a combination of WaveTrend crossovers, RSI, and MFI indicators, providing multidimensional market analysis. Market Cipher A is optimized for use with Heiken Ashi candles and is best applied within trend-following strategies, ideally combined with other Market Cipher indicators for enhanced entry and momentum confirmation.
カスタマーレビュー
5 | 67 % | |
4 | 33 % | |
3 | 0 % | |
2 | 0 % | |
1 | 0 % |


