
説明
ショーケース:
スーパー・トレンド・インジケーター – トレーダーにとって必須のツールで、市場のトレンドに乗りやすく、より賢明な投資判断を可能にします!この直感的でプロフェッショナルなインジケーターは、初心者でも経験豊富な投資家でも、明確な買いと売りのシグナルを提供するよう設計されています。
なぜスーパー・トレンド・インジケーターを選ぶのか?
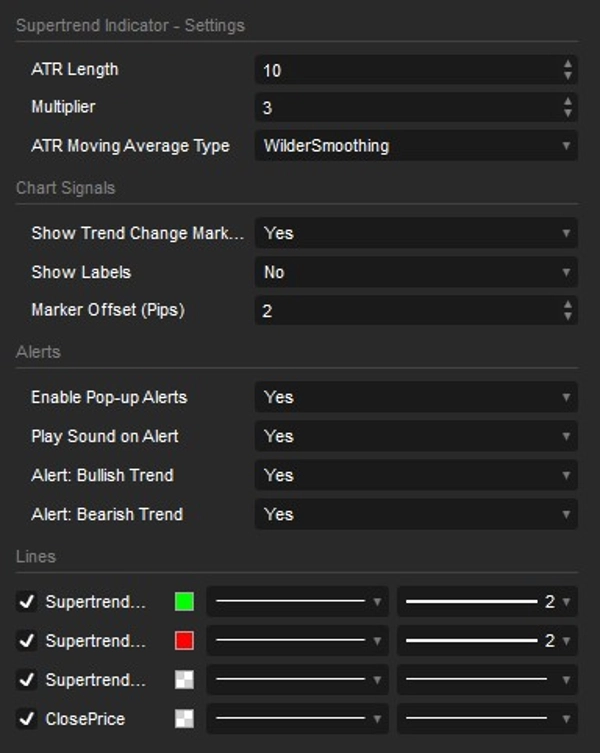
- 業界標準の精度: カスタマイズ可能なATR移動平均タイプ(ワイルダーのスムージングを含む)を搭載。TradingViewのような主要チャートプラットフォームで見られる最も人気のあるプレミアムスーパー・トレンド版と同様に計算・反応します!
- 100%ノンリペイント: 堅牢なトレンド記憶メカニズムを備えています。一度トレンドが変わりシグナルが表示されると、そのまま残ります。リペイントなし、矢印の消失なし、チャート履歴をスクロールしても再計算エラーなし。
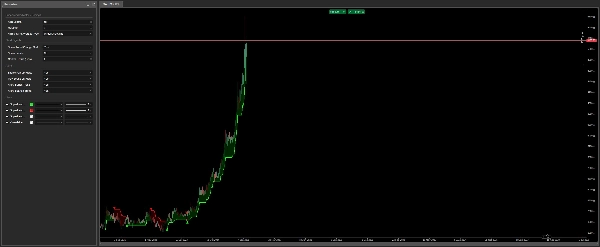
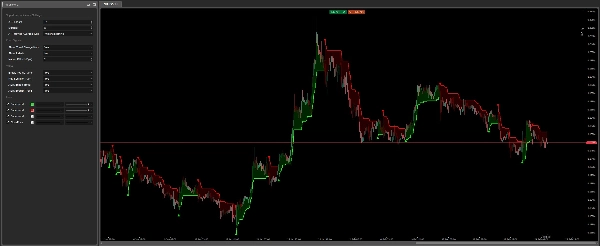
- シンプルさと効果的な機能: インジケーターは自動的にスーパー・トレンドラインを描画し、市場が上昇しているときは緑色(買いシグナル)、下降しているときは赤色(売りシグナル)に変わります。トレンドの方向が常に正確にわかります。
- スマートなリアルタイム通知: 取引のチャンスを逃しません!インジケーターはネイティブのcTraderポップアップと統合されたサウンド効果を利用したアップグレードされたアラートシステムを備えています。さらに、スパム防止機能により、リアルタイムシグナルが発生した際に一度だけ通知され、チャートの読み込みや再読み込み時の煩わしい音のスパムはありません。
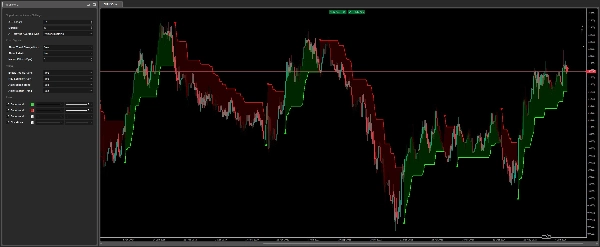
- 強化された視覚的シグナルとクラウドフィル: 重要なトレンド変化のたびに、目を引く矢印とオプションの「強気」/「弱気」テキストラベルが表示されます。スーパー・トレンドラインと価格の間に微妙で動的なクラウドフィルがあり、市場の勢いを一目で把握しやすくします。
- 完全にカスタマイズ可能で正確: ATRの期間や乗数などの基本設定を簡単に調整できます。動的なピップベースのオフセットを使って矢印やラベルの距離を正確に制御でき、どの資産でも完璧で整理された視覚効果を実現します。
スーパー・トレンド・インジケーターは、市場分析を簡素化したいすべての人に最適です。トレンドを簡単に見つけたい初心者トレーダーから、戦略のために非常に正確でリペイントしないシグナルを求める熟練のプロフェッショナルまで対応します。Forex、株式、指数、暗号通貨など、あらゆる市場とすべての時間枠で完璧に機能します。
概要
AIによる概要
The Supertrend Indicator v1.1 is a professional-grade trading tool designed to identify market trends and provide clear buy and sell signals. It features customizable ATR moving average types, including Wilder's smoothing, ensuring accuracy comparable to leading platforms. The indicator is 100% non-repainting, maintaining stable signals without recalculation errors or disappearing markers. It visually represents trends with a line that turns green during upward movements and red during downward trends, complemented by arrows, optional "Bullish"/"Bearish" labels, and a dynamic cloud fill to highlight market momentum. Real-time alerts use native cTrader pop-ups and sound effects with built-in spam protection, notifying users once per signal. Users can adjust key parameters such as ATR length, multiplier, and visual offsets for precise, uncluttered display across all asset types. The Supertrend Indicator supports multiple markets including Forex, Stocks, Indices, and Cryptocurrencies, and is suitable for all timeframes. It is designed for traders of all experience levels seeking a reliable, easy-to-interpret trend analysis tool.
インジケーターのプロフィール
カスタマーレビュー
4.3
レビュー: 3
5 | 33 % | |
4 | 67 % | |
3 | 0 % | |
2 | 0 % | |
1 | 0 % |
カスタマーレビュー
November 4, 2025
Smooth and steady - Supertrend v1.1 keeps you riding the trend with confidence. Clear color switches show when momentum flips, helping you enter early and exit smart. Fast, reliable, and a classic trend tool that belongs in every trader’s arsenal. Pairs perfectly with momentum filters or ATR-based setups for precision entries!
August 6, 2025
ディスカッション
よくあるご質問
Signal
Indices
Commodities
GBPUSD
RSI
Bollinger
Fibonacci
Scalping
AI
XAUUSD
NAS100
MACD
BTCUSD
Forex
Breakout
EURUSD
NZDUSD
Martingale
Prop
ZigZag
Supertrend
Fair Value Gap
SMC
Crypto
Grid
Stocks
ATR
USDJPY
VWAP
cTrader Storeで入手可能な取引ボット、インジケーター、プラグインなどの商品は、第三者の開発者が提供するものであり、情報と技術の取得のみを目的としてご利用いただけます。cTrader Storeはブローカーではなく、投資助言や個人的な推奨を行うことも、将来のパフォーマンスを保証することもありません。


価格
88
販売
147
無料インストール