
Описание
Candles Volume Delta — мощный, визуально интуитивный индикатор, который преобразует необработанный тиковый объем в полезные торговые инсайты. Окрашивая бары цены на основе давления объема покупок/продаж, он предоставляет мгновенный визуальный сигнал рыночного настроения и силы, помогая вам заметить потенциальное продолжение тренда или разворот всего одним взглядом.
Ключевые особенности
-
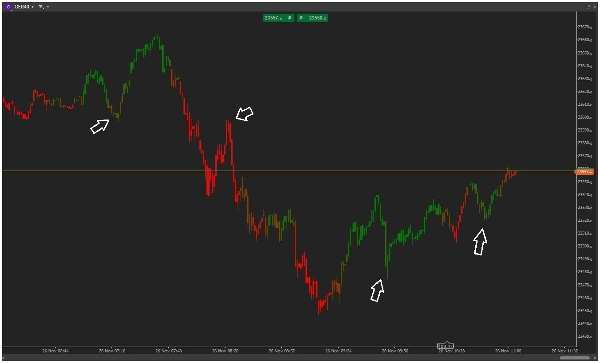
- 🟢 Визуальный анализ объема: Окрашивает каждый бар цены на основе доминирования объема покупок/продаж
- 📊 Умный расчет дельты: Вычисляет дельту объема за заданный пользователем период
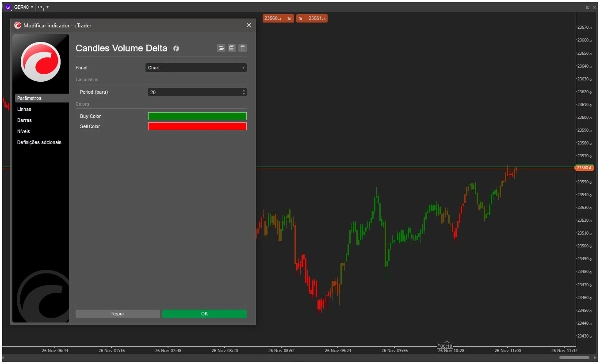
- 🎨 Настраиваемые цвета: Полностью регулируемые цветовые схемы для покупок/продаж
- ⚡ Обработка в реальном времени: Оптимизирован для мгновенной визуальной обратной связи по новым барам
- 🛠️ Простая настройка: Простая конфигурация с разумными значениями по умолчанию
Как это работает
Candles Volume Delta анализирует тиковый объем за указанный вами период (по умолчанию: 20 баров) и вычисляет процент объема покупок относительно объема продаж:
-
- Зеленые бары: Высокое давление покупателей (обычно >60% объема покупок)
- Красные бары: Высокое давление продавцов (обычно <40% объема покупок)
- Градиентные цвета: Плавные переходы цвета показывают промежуточные уровни силы
Индикатор использует сглаживание на основе ATR, чтобы обеспечить стабильные, значимые сигналы, адаптирующиеся к текущей волатильности рынка.
Применение в торговле
-
- Подтверждение тренда: Подтверждайте силу тренда с помощью объема
- Сигналы разворота: Определяйте потенциальные развороты, когда ценовое движение противоречит потоку объема
- Подтверждение пробоев: Подтверждайте пробои с помощью сопутствующих объемных данных
- Рыночное настроение: Оценивайте доминирование покупателей/продавцов в любом таймфрейме
Почему Candles Volume Delta?
В отличие от сложных индикаторов объема, загромождающих ваш график, Candles Volume Delta обеспечивает мгновенную визуальную обратную связь через простое цветовое кодирование. Он легкий, быстрый и предоставляет вам необходимую информацию об объеме без излишних данных.
Идеально подходит трейдерам, которые хотят:
-
- Быстро оценивать рыночное настроение
- Чистый, незагроможденный анализ графиков
- Визуальное подтверждение ценовых движений
- Легко интегрировать в существующие стратегии
Установите сегодня и смотрите на рынки через призму динамики объема!
Сводка
Key features include customizable color schemes, real-time processing for instant visual feedback, and easy setup with sensible defaults. The indicator helps traders quickly assess market sentiment, confirm trends, identify potential reversals, validate breakouts, and gauge buyer/seller dominance across timeframes. It is designed to provide essential volume insights without cluttering the chart, making it suitable for integration into various trading strategies, including scalping and trend analysis. Supported markets include indices and other instruments where volume analysis is relevant.
Отзывы покупателей
5 | 100 % | |
4 | 0 % | |
3 | 0 % | |
2 | 0 % | |
1 | 0 % |


