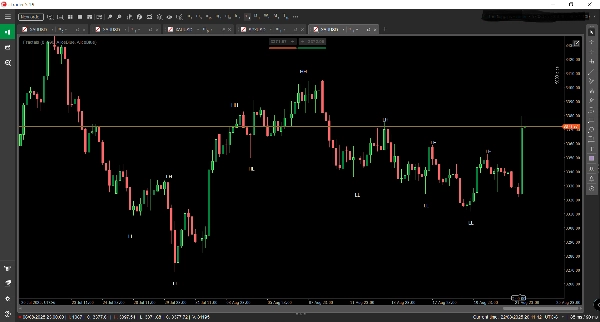
指标
Indices
Prop
Commodities
Stocks
Forex
Crypto
Fractals
"Fractals" 标识
04/09/2025
1
Desktop
Since 08/08/2025
销售
2
Free installs
243
"Fractals" 已上传图片

🧠 Fractals – Market Structure Visualized

Fractals is a precision-engineered trading indicator for cTrader that reveals the hidden architecture of price action. By automatically detecting and labeling Higher Highs (HH), Higher Lows (HL), Lower Highs (LH), and Lower Lows (LL) directly on the chart, Fractals transforms raw price data into a clear, actionable map of market structure.

🔍 Key Features:

  • Real-Time Structure Mapping: Instantly identifies swing points and labels them to expose trend direction and reversal zones.
  • Multi-Timeframe Awareness: Designed to highlight macro structure on higher timeframes, giving traders a strategic edge in aligning entries with dominant trends.
  • Trend Following Optimization: Ideal for traders using momentum, breakout, or pullback strategies, helping confirm bias and avoid counter-trend traps.
  • Clean Visual Overlay: Elegant chart annotations that integrate seamlessly with any trading setup, enhancing clarity without clutter.

🧭 Use Cases:

  • Spot emerging trends and structural shifts before they’re obvious.
  • Validate trade setups with structural confirmation.
  • Combine with moving averages, volume, or custom indicators for layered confluence.
  • Perfect for manual backtesting and prop firm evaluations where structure-based logic is key.
该作者的其他作品
FVG
The Indicator is a powerful tool for price-action traders seeking to identify and exploit short-term imbalances.
指标
Indices
Prop
Stocks
+3
Smooth Heiken Ashi
The Smooth Heiken Ashi indicator is a refined charting tool designed to filter out market noise and highlight true price
pATR
An indicator that redefines ATR by applying a percentile-based filter giving traders a grounded view of volatility.
DEnvelopSystem
DEnvelop is a high-performance trading indicator engineered for scalpers and intraday strategists who demand precision.
指标
NAS100
Indices
XAUUSD
+4
PrevDayProjection
Automatically calculates the previous day’s high and low, determines the range, and then projects Fibonacci levels.
指标
Indices
Prop
Breakout
+3
RVI
A precision-crafted indicator that compares current volume to its historical average for the same time of day.
指标
Grid
NAS100
XAUUSD
+6
AutoFibRetracement
A powerful overlay tool designed to automatically plot Fibonacci retracement levels based on a custom window.
指标
Indices
XAUUSD
Breakout
+3
AnchoredVWAP
A precision overlay tool that combines session-aware VWAP logic and standard deviations.
指标
Breakout
AI
Scalping
KaufmanEfficiencyRatio
A precision tool for measuring how efficiently price moves from point A to B.
指标
Indices
Breakout
Prop
+8
MarketRegimeAI
A cutting‑edge trading indicator that fuses AI and mathematics with adaptive logic to classify market regimes.
指标
Indices
Prop
Commodities
+3
OBScope
A cutting-edge indicator designed to detect and visualize high-probability zones based on swing highs, swing lows.
指标
Indices
Commodities
Stocks
+2
MARainbow
MARainbow gives you the edge with four customizable moving averages—each color-coded for instant recognition.
ORB2
A high-performance cBot engineered to capture explosive moves in the gold market using the proven Opening Range Breakout
猜您喜欢
指标
NZDUSD
Forex
EURUSD
+2
4 RCS Relative Strength w Alerts_NSC
Forex Strength Meter for cTrader: 4 custom currencies, cross alerts, visual arrows. Trade smarter!
指标
Breakout
ATR
Signal
UT Bot
ATR-based trend following tool with trailing stop logic. Highlights crossovers using clean up/down bands and bar colour.
VWAP
Track VWAP for Asia, London, NY, Sydney, Daily, Weekly, Monthly & Custom Sessions. Perfect for FX & intraday trading!
Reko Wic
Visualize global Forex trading sessions with clear time blocks for better timing and strategy planning.
指标
Stocks
Commodities
Forex
buy sell
SmartSignal Pro: Precise BUY/SELL signals to profit in any market. Trade like a pro! 🚀
指标
Forex
VegaXLR - Candlestick Patterns Pro
Identify 34 candlestick patterns, track trends across timeframes, and get instant alerts with this powerful trading tool
BWMFI_Visual
BW_MFI Vizual colors bars
指标
RSI
XAUUSD
Breakout
+4
ICT Power of 3
🎯 Auto-plots key zones (Accumulation, Manipulation, Distribution) . Reveals institutional traps & trends.
指标
Grid
Indices
Breakout
+8
TSPivotSMC
Pivot Point MultiTimeFrame with Order Block
指标
Indices
Commodities
Stocks
+2
MARainbow
MARainbow gives you the edge with four customizable moving averages—each color-coded for instant recognition.
VWAP Tank Btn
Custom Vwap Indicator
指标
RSI
Breakout
XAUUSD
+6
Multi-Asset Performance Matrix
Visual tool tracking financial assets' % performance across timeframes, highlighting trends with color-coded insights.
指标
Indices
Stocks
Forex
+1
TwoSMA.cs
An indicator that accurately shows the trend direction. A vital tool for clear trading decisions.
指标
NAS100
NZDUSD
XAUUSD
+11
Market Info bY MohammadKHR
Daily High & Low with live Percentage change.
Fx4U.Multi Trend Line Indicator
Allow trader to draw multi trendlines in different timeframes on one chart,Give trader an overview of the current market
Previous Day Liquidity Zones (PDH - PDL)
Useful indicator for traders who want to visualize key price levels based on previous daily highs and lows.
overbought oversold
Overbought Oversold Indicator
VolumeColorBar
Color Volume Bars – Visualize Market Strength Instantly