
说明
🧠 公允价值缺口 (FVG) 指标
精准揭示隐藏的市场失衡
公允价值缺口 (FVG) 指标是价格行为交易者用来识别和利用由激进机构订单流引起的短期低效的强大工具。基于稳健的三根K线逻辑,它自动检测看涨和看跌的FVG区域——价格可能回归然后继续趋势的区域。
🔍 主要特点
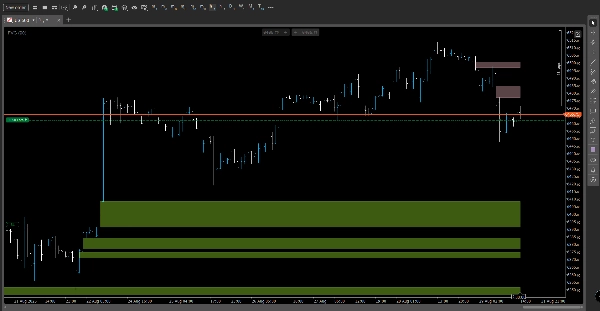
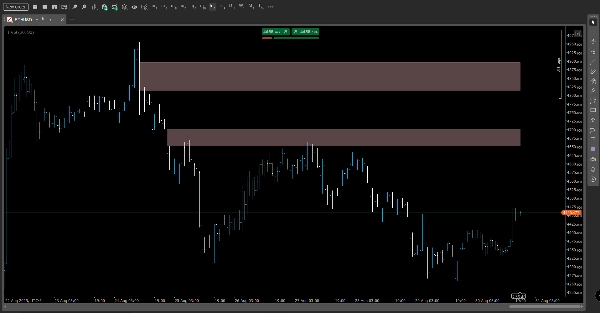
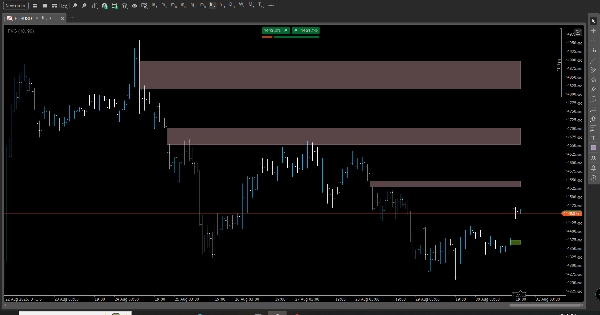
- 自动FVG检测:使用基于蜡烛缺口的干净、不重绘的矩形突出显示失衡区域。
- 缓解跟踪:监控价格何时回访并填补缺口,更新视觉效果并记录缓解事件。
- 未缓解区域叠加:以粗体水平线显示活动的FVG,便于快速参考和交易规划。
- 自适应阈值设定:选择手动或自动阈值模式,以微调在波动或平静市场中的灵敏度。
- 自定义视觉效果:配置颜色、不透明度和投影长度,以匹配您的图表风格。
- 终端日志记录:紧凑日志报告总缺口、缓解情况和活动区域——完美用于策略验证。
🎯 优势
- 清晰的交易参考:将FVG区域用作回归目标、反应区或与其他智能资金概念的汇合点。
- 低视觉占用:简洁设计保持图表可读性,同时保留必要的失衡背景。
- 可靠的回测:封闭K线逻辑确保信号稳定且不重绘。
- 多时间框架支持:适合剥头皮交易者、波段交易者和机构风格分析师。
👤 适用人群
- 智能资金与ICT交易者
- 价格行为纯粹主义者
- 验证订单流反应的量化分析师
- 寻求基于市场结构的高概率入场点的交易者
摘要
AI 摘要
The Fair Value Gap (FVG) Indicator is designed for price-action traders to identify short-term market imbalances caused by institutional order flow. It uses a 3-bar logic to automatically detect bullish and bearish FVG zones—price gaps where the market may return before continuing its trend. Key features include automated detection with non-repainting rectangles, mitigation tracking that updates when gaps are filled, and an overlay of active unmitigated zones for easy reference. Users can adjust sensitivity via manual or automatic threshold modes and customize visual elements such as colors and opacity. The indicator logs gap statistics and mitigation events in the terminal for strategy validation. It supports multi-timeframe analysis, making it suitable for scalpers, swing traders, and institutional-style analysts. The FVG Indicator provides clear trade reference points, a low visual footprint to maintain chart readability, and reliable backtesting signals based on closed-bar logic. It is intended for traders focused on smart money concepts, price action, and order-flow validation seeking high-probability entries aligned with market structure.
指标配置
客户评价
0.0
评价:0
客户评价
该产品尚无评价。已经试过了?抢先告诉其他人!
讨论
常见问答
cTrader Store 提供的所有产品,包括交易机器人、指标和插件,均由第三方开发者提供,仅供信息参考和技术访问之用。cTrader Store 并非经纪商,不提供投资建议、个人推荐或任何未来业绩保证。


价格
26
销售
2.14K
免费安装