
⚡ Kaufman效率比率(KER)
趋势清晰度,量化体现。
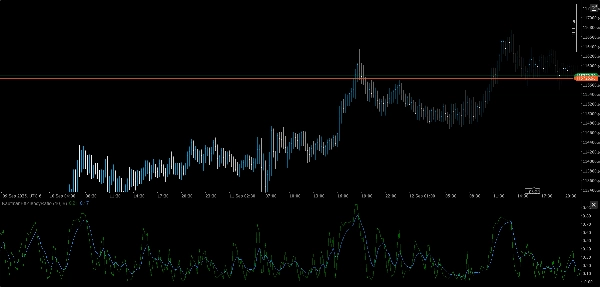
Kaufman效率比率(KER)是一种精确工具,用于衡量价格从点A到点B的移动效率——而不会被噪音干扰。无论您是在验证突破条件还是过滤横盘震荡,KER都能为您提供一个介于0到1之间的清晰分数,反映方向意图与波动性的关系。
🔍 它的作用
- 计算Kaufman效率比率:
- 输出一个归一化值,从 0(纯噪音) 到 1(完美趋势)
- 明确区分趋势与非趋势状态,无任何歧义
- 适用于自适应叠加、状态过滤和信号门控
🛠️ 主要特征
- 模块化输入管理,支持多时间框架数据源
- 跨资产兼容:外汇、加密货币、指数、股票
- 轻量级、实时逻辑,无平滑延迟
- 即插即用,兼容您现有的套件架构
🎯 使用场景
- 趋势验证:在信号执行前确认方向偏好
- 噪音过滤:抑制低效价格行为期间的入场
- 状态检测:与波动感知叠加配合,实现更智能的转换
- 策略构建:作为突破、动量或偏好逻辑的核心指标
💡 额外提示
KER免费、快速且极其高效——就像您的代码一样。无冗余,无过滤。只有纯粹的市场意图,提炼而成。
指标配置
0.0
评价:0
客户评价
该产品尚无评价。已经试过了?抢先告诉其他人!
Breakout
Scalping
AI
cTrader Store 提供的所有产品,包括交易机器人、指标和插件,均由第三方开发者提供,仅供信息参考和技术访问之用。cTrader Store 并非经纪商,不提供投资建议、个人推荐或任何未来业绩保证。


!["[Stellar Strategies] Smart ADX" 标识](https://cdn.ctrader.com/image/webp/af13b084-b6f6-41db-b7bc-c7e688b57b05_36929)


25
销售
2.1K
免费安装