
说明
VA Footprint 按滴答簇分组攻击,消除了跨级别交叉引用的需要。该结构还提供了对高频交易欺骗(如洗盘交易或混杂在噪音中的激进订单,旨在掩盖买卖价位的意图)的抵抗力。由于它测量的是10个或更多滴答簇的承诺,机构活动很难且成本高昂地隐藏他们的足迹。
可调参数(相关设置)
- 盒子持续时间(分钟)--> 调整以匹配您的图表时间框架
- 级别大小(%)
- 暗模式(true/false)
- 显示价值区域(true/false)
- 成交量时间框架(10滴答,50滴答)
重要注意事项
- 带有滴答精度的市场回放功能可用,您可以使用它来回测您的策略并测试指标的更长周期。
- 增加滴答级别可提高精度,减少过多会降低准确性,至少建议0.10。
摘要
AI 摘要
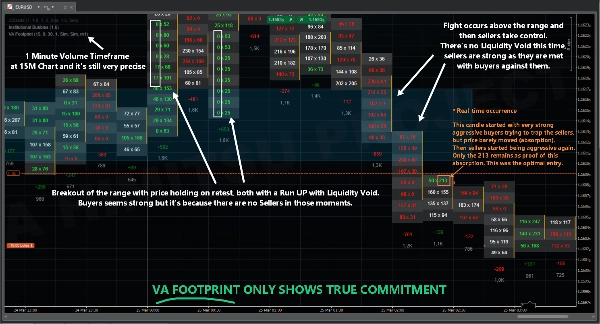
VA Footprint is an order flow indicator that replaces traditional charts with a detailed footprint view, enabling precise market reading. It groups aggressive trading activity by clusters of ticks (typically 10 or more), reducing the need to cross-reference price levels and providing resilience against high-frequency trading spoofing tactics such as wash trading or disguised aggressive orders. This clustering approach makes it difficult for institutional activity to conceal their market footprints.
Key adjustable parameters include box duration (to align with chart timeframe), level size percentage, dark mode toggle, value area display, and volume timeframe selection (e.g., 10-tick or 50-tick clusters). The indicator supports market replay with tick precision, allowing users to backtest strategies over extended periods.
VA Footprint is applicable across multiple markets including Forex, indices, and stocks, and supports trading strategies such as scalping and smart money concepts. It provides visualizations, signals for divergences, breakouts, reversals, trend strength, volatility regimes, and level breaks, relying on tick data, bars, and volume inputs. This tool is designed to enhance market structure analysis and order flow understanding for traders.
指标配置
指标分类
订单流/深度图
输出类型
可视化
信号
过滤器
数据要求
跳动点数据
仅 K 线
交易量
支持的信号
背离
突破
反转
趋势强度
波动性
突破水平位
客户评价
4.5
评价:4
5 | 50 % | |
4 | 50 % | |
3 | 0 % | |
2 | 0 % | |
1 | 0 % |
客户评价
April 10, 2026
A decent setup here should survive 1 percent risk without looking messy. The first month should show both ROI and DD. The next review on it on 30 trades.
April 4, 2026
For risk management, this feels more useful as a filter than a full system. The journal should cover 76 setups and the trade context.
April 4, 2026
The stats tell the story. Tracking 1 percent risk first, compare the result with BE after 1R, and only scale if 1.5R partials still looks controlled.
March 31, 2026
Feels right for a user who wants less noise in the process. The best use is sizing and stop planning, then leaving the final filter manual. The problem appears when the tool makes weak ideas look acceptable.5R partials.
讨论
常见问答
Prop
Forex
Scalping
Indices
SMC
Stocks
Market Structure
cTrader Store 提供的所有产品,包括交易机器人、指标和插件,均由第三方开发者提供,仅供信息参考和技术访问之用。cTrader Store 并非经纪商,不提供投资建议、个人推荐或任何未来业绩保证。
该作者的其他作品


价格
注册日期 24/03/2026
10
销售
62
免费安装