

说明
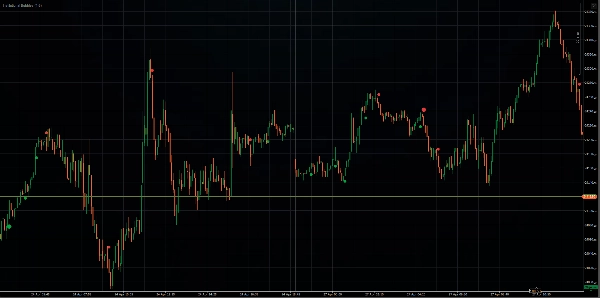
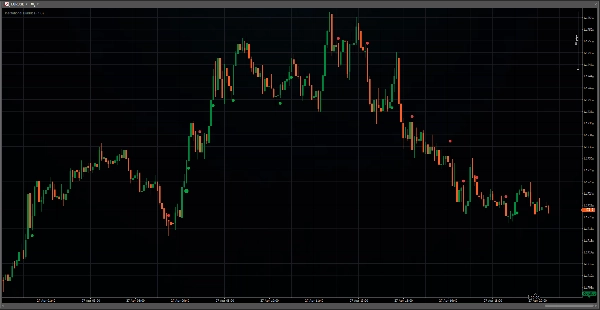
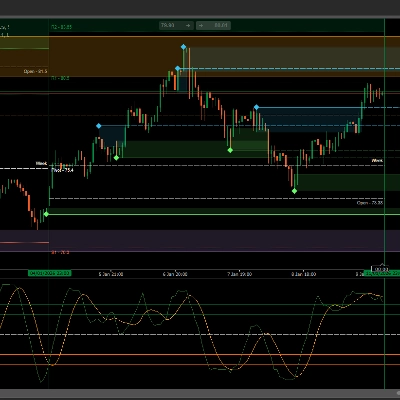
Institutional Bubbles 专注于检测机构参与。
__ 机构活动随着流动性条件和市场环境而变化。为了解决这个问题,该指标应用了一种专有算法,结合基于 lambda 的归一化和滚动 VWAP,以隔离明显的不平衡模式。目标不是突出和使用明显的可疑信号,而是突出和使用人为“正常”和均衡的活动。 __
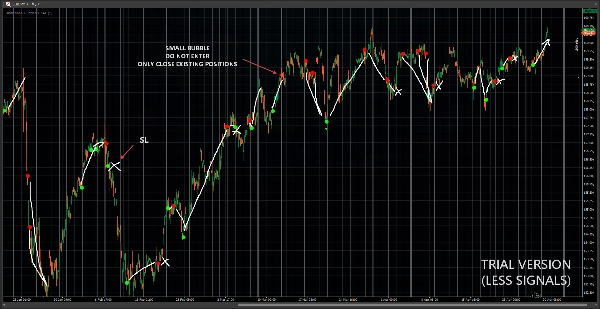
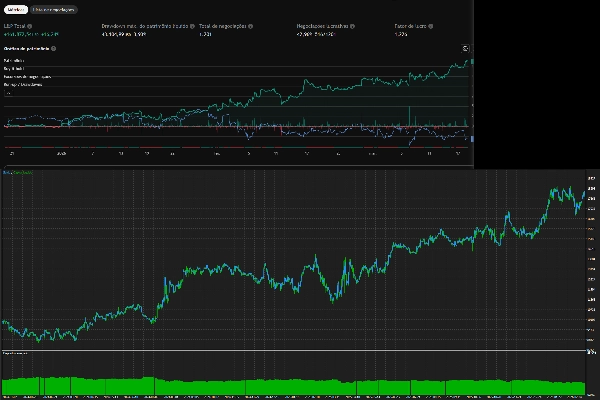
这是一个完全量化的系统。我们在其他平台上进行了回测,结果显示盲目跟随大规模气泡产生了稳定的优势,该优势在1000多笔交易中得到了验证(回测遵循信号方向,并在出现相反信号时平仓,未使用任何过滤器或其他指标)。由于在所有符号上都有稳定的优势,该指标非常适合将您的策略提升到另一个水平,增强您的入场信心。
* 默认配置(灵敏度=1.6 或更低)适用于所有符号。
* 支持所有符号和时间框架,但建议使用 M1 或 M5 以获得最精确的读取。
* 我们不出售自动交易算法。
摘要
AI summary
Institutional Bubbles is a trading indicator designed to detect and quantify institutional participation in the market by analyzing volume and price action patterns. It uses a proprietary algorithm that combines lambda-based normalization with a rolling Volume Weighted Average Price (VWAP) to isolate subtle, balanced trading activity rather than obvious imbalances. This approach aims to reveal hidden institutional trading signals that are typically "normal" in appearance but carry predictive value.
The indicator supports all symbols and timeframes, with a recommendation to use 1-minute or 5-minute charts for the most precise readings. Its default sensitivity setting (1.6 or lower) is optimized for broad applicability across markets. Institutional Bubbles provides fully quantified signals that have been backtested over 1000+ trades across multiple platforms, demonstrating a consistent edge when following the indicator’s directional signals without additional filters.
Key features include visualization of institutional activity, signal generation for breakouts, reversals, trend strength, volatility regimes, and support/resistance levels. It requires only bar data and is categorized under support and resistance indicators. This tool is intended to enhance trading strategies by offering insights into hidden market dynamics driven by large participants.
The indicator supports all symbols and timeframes, with a recommendation to use 1-minute or 5-minute charts for the most precise readings. Its default sensitivity setting (1.6 or lower) is optimized for broad applicability across markets. Institutional Bubbles provides fully quantified signals that have been backtested over 1000+ trades across multiple platforms, demonstrating a consistent edge when following the indicator’s directional signals without additional filters.
Key features include visualization of institutional activity, signal generation for breakouts, reversals, trend strength, volatility regimes, and support/resistance levels. It requires only bar data and is categorized under support and resistance indicators. This tool is intended to enhance trading strategies by offering insights into hidden market dynamics driven by large participants.
指标配置
指标分类
支撑与阻力
输出类型
可视化
信号
过滤器
数据要求
仅 K 线
支持的信号
突破
反转
趋势强度
波动性
突破水平位
触及水平位
客户评价
4.5
评价:2
5 | 50 % | |
4 | 50 % | |
3 | 0 % | |
2 | 0 % | |
1 | 0 % |
讨论
常见问答
Volume
Market Structure
Supply & Demand
VWAP
Support & Resistance
cTrader Store 提供的所有产品,包括交易机器人、指标和插件,均由第三方开发者提供,仅供信息参考和技术访问之用。cTrader Store 并非经纪商,不提供投资建议、个人推荐或任何未来业绩保证。








!["[Hamster-Coder] Bollinger Bands" 标识](https://cdn.ctrader.com/image/webp/21d8e5d6-fb11-4bac-b9ee-cd05c2b76804_30327)












价格
注册日期 24/03/2026
13
销售
116
免费安装