
Descripción
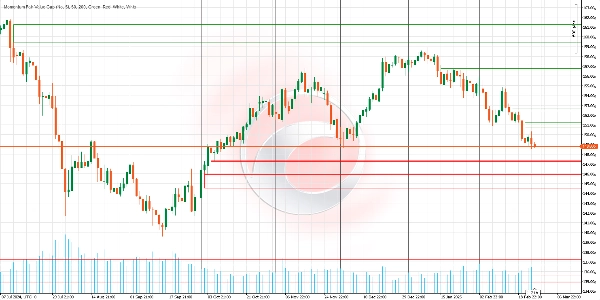
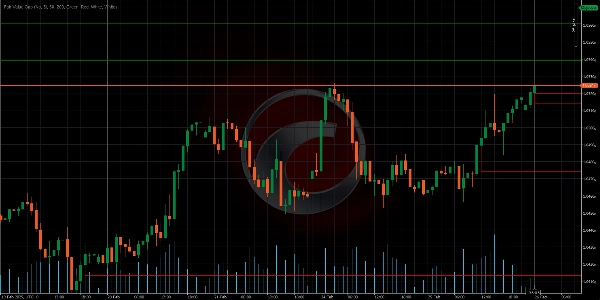
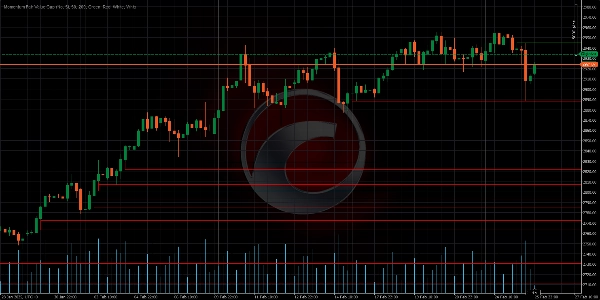
Identifica áreas de desequilibrio del mercado (Brechas de Valor Justo o FVGs) y las proyecta en el gráfico de manera inteligente. A diferencia de otros indicadores, este se adapta en tiempo real a la acción del precio, ajustando su tamaño, persistencia y relevancia. Es ideal para traders que buscan objetivos claros y una gestión visual avanzada de las brechas.
✨ CARACTERÍSTICAS PRINCIPALES
- Ajuste Dinámico de Brechas
Lógica: Si el precio toca parcialmente un FVG (por ejemplo, roza el límite inferior), el indicador redimensiona automáticamente la brecha para reflejar solo el área descubierta.
Beneficio: Evita señales falsas y mantiene activas solo las brechas con potencial real. - Relleno en el Punto Medio
Lógica: Dibuja una línea en el centro de la brecha. Si el precio la toca, el FVG se considera "rellenado" y puede eliminarse (configurable).
Beneficio: Requiere solo un contacto del 50% para confirmar el cierre, filtrando ruido y operaciones prematuras. - Proyección Infinita Hasta Rellenarse
Lógica: Las brechas se extienden indefinidamente hacia el futuro (no desaparecen después de X velas).
Beneficio: Proporciona una referencia persistente hasta que el mercado resuelve el desequilibrio. - Limpieza Automática de Brechas Invalidas
Lógica: Elimina automáticamente las brechas antiguas cuando están completamente rellenadas.
Beneficio: Mantiene el gráfico limpio y enfocado en zonas activas. - Personalización Visual Avanzada
Opciones: Diferentes colores para brechas alcistas (verde) y bajistas (rojo). Ajuste de transparencia para evitar saturación en el gráfico.
Beneficio: Se adapta a cualquier estilo de trading o estrategia visual.
🎯 ¿CÓMO USARLO EN EL TRADING?
Identificación de Zonas Clave:
- FVG Alcista (Verde): Área donde los compradores perdieron fuerza temporalmente.
→ Estrategia: Buscar oportunidades de compra durante retrocesos hacia esta zona. - FVG Bajista (Rojo): Área donde los vendedores fueron superados.
→ Estrategia: Buscar oportunidades de venta durante rallies hacia esta zona.
Interacción con el Precio:
- Si la brecha se ajusta dinámicamente (reduce su tamaño), indica que el mercado está probando la zona pero sin confirmación.
- Si la brecha se elimina (por relleno completo o Punto Medio), considere que el desequilibrio está corregido.
🔍 CONFIRMACIÓN CON OTRAS HERRAMIENTAS
Combine los FVGs con soportes/resistencias, volumen o RSI para filtrar señales.
📋 COMPARACIÓN DE FUNCIONES
___________________________________________________________________________________
Función Momentum Fair Value Gap Indicadores Tradicionales
________________________________________________________________________________
Persistencia---------------- Extiende brechas hasta rellenarse ----------------------- Desaparecen después de X velas
Precisión de Cierre-------- Opción de confirmación al 50% --------------------- Requiere relleno completo de la brecha
Flexibilidad ------------------ Se redimensiona con el precio ------------------------- Niveles estáticos e inmutables
Enfoque Visual---------------- Elimina brechas irrelevantes ----------------------- Satura el gráfico con datos pasados
📝 EJEMPLO PRÁCTICO
Escenario en EURUSD (1H):
Se forma un FVG Alcista (verde) después de una vela bajista pronunciada. Días después, el precio retrocede, tocando el límite inferior de la brecha pero sin rellenarla. El indicador reduce automáticamente el tamaño de la brecha. Finalmente, el precio toca el Punto Medio (línea central), lo que desencadena su eliminación. El trader entra en corto tras confirmar el rechazo en la zona.
Indicadores de Ctrader Store:
Dynamic Market Structure
Analysis of Turning Points
Fibonacci Linear
Regression Multi-timeframe
Multi-Level Candle Bias
Tracker
Auto Support and
Resistance Trend Lines
Resumen
Key features include:
- Dynamic Gap Adjustment: Automatically resizes gaps when price partially touches them, reducing false signals.
- MidPoint Fill: Marks the gap centerline; if price touches it, the gap is considered filled and can be removed, requiring only 50% contact for confirmation.
- Infinite Projection: Gaps extend indefinitely until filled, maintaining persistent market imbalance references.
- Automatic Cleanup: Removes fully filled gaps to keep charts focused on active zones.
- Advanced Visual Customization: Uses distinct colors for bullish (green) and bearish (red) gaps with adjustable transparency.
In trading, bullish FVGs indicate zones where buyers lost strength, suggesting buying opportunities on pullbacks; bearish FVGs mark where sellers were overtaken, indicating selling opportunities on rallies. The indicator’s dynamic interaction with price helps confirm market imbalance resolution.
It is recommended to combine this indicator with other tools like support/resistance levels, volume, or RSI for signal filtering.
Valoraciones de clientes
5 | 0 % | |
4 | 100 % | |
3 | 0 % | |
2 | 0 % | |
1 | 0 % |


