
Descrizione
🚀 Oltre 10.000 trader utilizzano già i nostri MIGLIORI indicatori🏆
Scopri perché i professionisti ci scelgono – gli strumenti più potenti su cTrader (indicatori, algoritmi e cBot) ti stanno aspettando.
👉 Ottieni tutti i nostri sistemi TOP qui:
_______________________________________________
📌 Indicatori di Struttura di Mercato
· ✅ AdvancedMarket Structure: Bos, Choch, SwinLevels, Order Blocks, Market Structure& Liquidity Finder
· 🔄 Analisi Dinamica della Struttura di Mercato dei Punti di Inversione
· 🧱 Order Block
· ⚖️ Market Imbalance
· ⛓️ BOS & CHOCH
· 🧠 ICT Power of 3
· 🌀 Zone di Polarità di Mercato
_______________________________________________
🔚 Sistemi di Uscita Intelligenti
· 📍 Algoritmo Intelligente di Trailing
_______________________________________________
📐 Indicatori ZigZag
· 🔍 Proiezione della Liquidità del Prezzo ZigZag
· ➖ ZigZag
· 🎯 Tracciatore di Estremità Zig-Zag
_______________________________________________
🧱 Indicatori di Supporto e Resistenza
· 🟩 Linee di Supporto e Resistenza SmartTrend
· 🧱 Tutti i Livelli di Supporto e Resistenza
_______________________________________________
📊 Indicatori di Trend e Canale
· 📊 Supertrend
· ⚡Analizzatore di Trend Momentum
· 💥 Sistema di Breakout del Canale
· 🌈 Gradiente Dinamico di Trend
_______________________________________________
💧 Strumenti di Volume e Liquidità
· 📉 Mappa di Liquidazione della Leva
_______________________________________________
⚡ Indicatori di Momentum e RSI
· 🔎 Multi-Level Candle Bias
Tracker
_______________________________________________
🔮 Strumenti di Previsione e Proiezione
· 📐 Previsione Basata su Linreg& ATR
· 📏 Regressione Lineare di FibonacciMulti-timeframe
· 📈 Proiettore di Flusso di Mercato Alimentato dal Volume
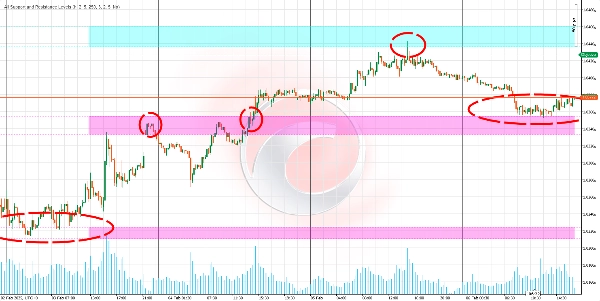
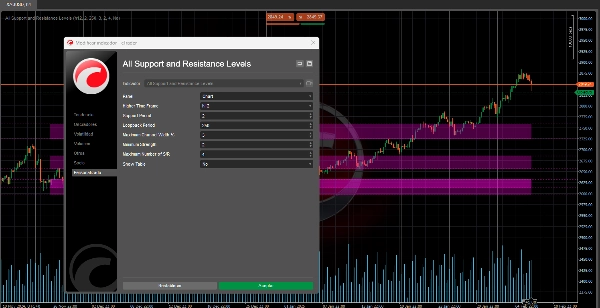
Questo algoritmo è un indicatore avanzato di supporto e resistenza progettato per aiutarti a identificare i livelli chiave nel mercato.
Il suo principale vantaggio è che ti permette di visualizzare i livelli di supporto e resistenza da qualsiasi timeframe (come giornaliero, settimanale o mensile) direttamente sul grafico che stai analizzando, anche se è su un timeframe diverso (ad esempio, 15 minuti o 1 ora). 📊⏰
A cosa serve? 🎯
Identificare le zone chiave del mercato:
- Individua i livelli dove il prezzo potrebbe fermarsi, rimbalzare o rompere con forza. 🛑↗️↘️
- Ti aiuta a prendere decisioni più informate su entrate, uscite e stop-loss. 💡📈📉
Analizzare più timeframe senza cambiare grafici:
- Visualizza livelli importanti da timeframe più alti (come giornaliero o settimanale) mentre fai trading su timeframe più bassi (come 15 minuti o 1 ora). 🕒📅
- Ti offre una visione di mercato più ampia senza dover cambiare continuamente grafici. 🌍🔍
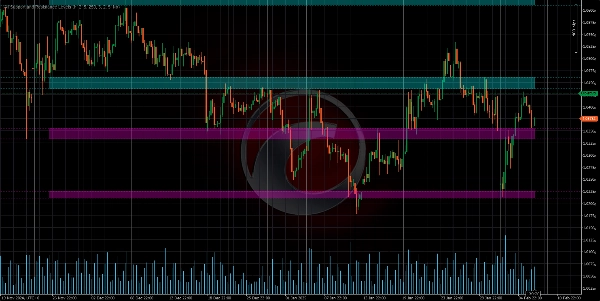
Dare priorità ai livelli significativi:
- L'indicatore classifica i livelli di supporto e resistenza in base alla loro "forza", ovvero quanto spesso il prezzo ha interagito con essi in passato. 💪📊
- Questo ti aiuta a concentrarti sui livelli più rilevanti e affidabili. 🎯✅
Come funziona la logica? 🧠⚙️
Raccolta dati:
- L'indicatore prende i prezzi massimi e minimi da un timeframe specifico (giornaliero, settimanale, ecc.). 📈📉
- Questi dati vengono usati per cercare modelli chiave nel comportamento del prezzo. 🔍📊
Rilevamento dei punti chiave (pivot):
- Identifica massimi e minimi locali—punti dove il prezzo ha raggiunto un picco o una valle rispetto ai prezzi vicini. ⛰️🌄
- Questi punti sono candidati a diventare livelli di supporto o resistenza. 🎯📌
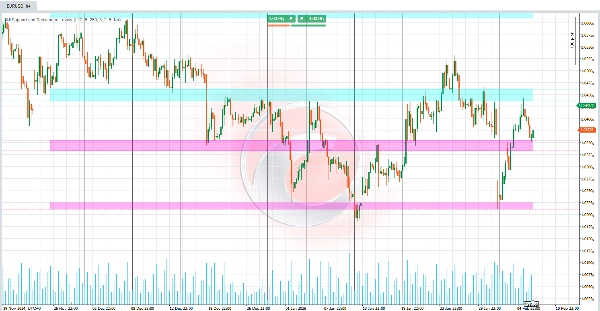
Raggruppamento dei livelli:
- I livelli vicini sono raggruppati per formare zone di supporto o resistenza, piuttosto che linee esatte. 🟦🟧
- Questo riflette l'idea che supporto e resistenza sono aree, non punti precisi. 📏🎯
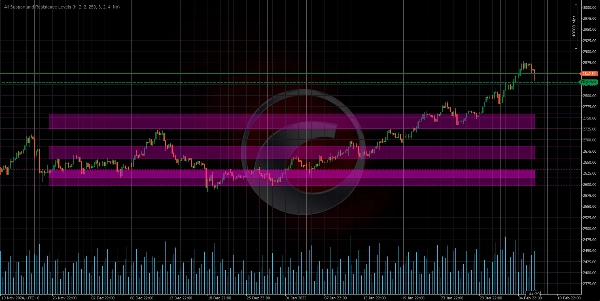
Calcolo della forza del livello:
La "forza" di un livello è determinata da due fattori:
- Frequenza dei tocchi: Quante volte il prezzo ha toccato o si è avvicinato a quel livello in passato. 🔄📊
- Raggruppamento dei punti chiave: Quanti massimi o minimi sono vicini a quel livello. 🔗📈
I livelli con maggiore forza sono considerati più significativi. 💪🎯
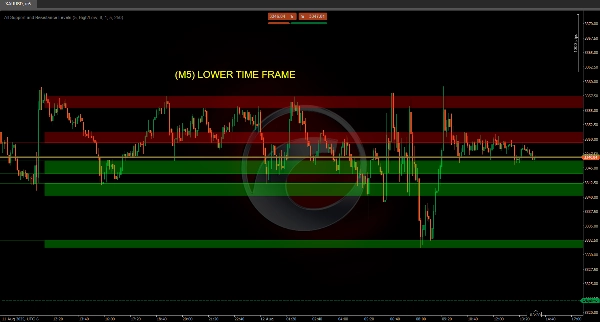
Visualizzazione sul grafico:
- I livelli sono disegnati come linee orizzontali o zone colorate sul grafico. 🎨📊
- Il colore di ogni livello dipende dalla posizione attuale del prezzo:
-
- Resistenza: Se il prezzo è sotto il livello. 🔴
- Supporto: Se il prezzo è sopra il livello. 🟢
- All'interno del range: Se il prezzo è all'interno dell'intervallo del livello. 🟡
Come puoi visualizzare diversi timeframe sul tuo grafico? 🕒📊
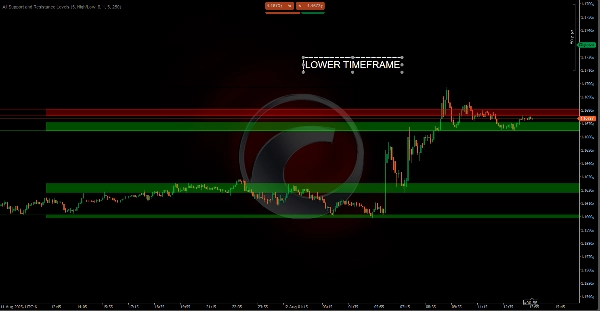
Supporto e resistenza da timeframe più alti su grafici a timeframe più bassi:
- Ad esempio, se stai analizzando un grafico a 15 minuti, l'indicatore può mostrare livelli chiave dal timeframe giornaliero o settimanale. 🕒📅
- Questo ti permette di vedere livelli importanti di contesto superiore senza lasciare il grafico attuale. 🌍🔍
Supporto e resistenza da timeframe più bassi su grafici a timeframe più alti:
- Sebbene meno comune, puoi anche visualizzare livelli da timeframe più piccoli (come 1 minuto o 5 minuti) su grafici a timeframe più alti (come giornaliero o settimanale). 🕒📅
- Questo può essere utile per analisi più dettagliate all'interno di un contesto più ampio. 🔍📊
Riepilogo
The indicator analyzes price data by collecting highs and lows from specified timeframes, identifying local pivot points where price peaks or valleys occur. These points are grouped into zones representing support or resistance areas rather than precise lines. Each level is assigned a strength score based on the frequency of price touches and the clustering of key points, helping users prioritize the most significant and reliable levels.
Visualized on the chart as horizontal lines or colored zones, the indicator uses color coding to indicate the price's position relative to each level: red for resistance (price below level), green for support (price above level), and yellow when price is within the level’s range. This tool assists traders in making informed decisions on entries, exits, and stop-loss placements by highlighting where price may stop, bounce, or break with strength.
Recensioni dei clienti
5 | 50 % | |
4 | 0 % | |
3 | 0 % | |
2 | 0 % | |
1 | 50 % |


![Logo di "High-Low Divergence [Iridio Capital]"](https://cdn.ctrader.com/image/webp/443c4661-7abb-40f1-842f-4b6ec560649b_40914)


