Descripción
Este no es tu típico Indicador de Delta de Volumen. Este es el Indicador de Delta de Volumen DOM Nivel 2 — Flujo de Órdenes de Grado Institucional para cTrader. La ventaja por la que las instituciones pagan millones.
El problema que enfrenta todo trader minorista. Una vela cierra en verde. El volumen es alto. Compras.
El precio se revierte instantáneamente. Te detienen. El gráfico te "mintió".
No mintió — simplemente no pudiste ver lo que estaba pasando dentro de la vela. ¿Esa barra verde con alto volumen? El 70% de ese volumen fue venta agresiva. El cierre fue sostenido por una capa delgada de órdenes de compra en la parte inferior del rango. Las instituciones estaban distribuyendo contra tu orden de compra.
Los indicadores de volumen estándar te muestran el total. Nunca te muestran quién estaba en control.
Volume Delta cambia eso. Lo que Volume Delta realmente te muestra
Volume Delta separa el volumen de cada barra en volumen de compra y volumen de venta, luego calcula la diferencia — el delta. Un delta positivo significa que los compradores fueron más agresivos. Un delta negativo significa que los vendedores dominaron.
Esta es la información más importante que separa a los traders profesionales de los minoristas: no cuánto se negoció, sino qué lado estaba operando con más agresividad. Eso es convicción. El delta es la huella digital de la intención detrás de cada barra de precio.
Pero no se detiene ahí
Este indicador no adivina. En una mezcla propietaria de datos lee datos de Profundidad de Mercado Nivel 2 — el libro de órdenes real detrás del precio que ves en pantalla.
Los datos de Nivel 2 (también conocidos como DOM — Profundidad de Mercado) muestran las órdenes reales de compra y venta apiladas en cada nivel de precio. No la última operación. No una estimación. La liquidez real en reposo de bancos, fondos de cobertura y mesas institucionales que fluye a través de los proveedores de liquidez de tu broker.
El resultado es un nivel de precisión de 85-95% en la clasificación de volumen de compra versus venta — mucho más allá de lo que cualquier aproximación basada en fórmulas puede lograr.
Por qué esto importa — Lo que las instituciones ven que tú no ves
Goldman Sachs, Citadel, Jump Trading — todos operan con datos de flujo de órdenes. Ven la presión de compra y venta en tiempo real. Ven la absorción. Ven cuando un nivel está siendo defendido. Ven cuando el delta diverge del precio.
Pagan millones por esta infraestructura. Las fuentes de datos, los servidores co-localizados, las herramientas propietarias.
Este indicador lleva el mismo concepto central a tu gráfico de cTrader. No una versión diluida. Los datos reales de DOM Nivel 2 de la piscina de liquidez de tu broker, procesados en la misma clasificación de compra versus venta que usan los traders profesionales de flujo de órdenes.
La diferencia entre un trader minorista y uno institucional no es inteligencia. Es información. Volume Delta cierra esa brecha.
Para quién es esto
Traders diarios que quieren ver más allá del ruido. Cuando una vela parece alcista pero el delta es negativo, sabes que debes esperar. Cuando una vela parece débil pero el delta es fuertemente positivo, sabes que las instituciones están acumulando. El delta no miente — muestra lo que pasó, no cómo parecía.
Scalpers que necesitan saber qué lado está en control en este momento. Un pico en delta en una ruptura confirma que es real. Una ruptura con delta plano te dice que es una trampa antes de que comience la reversión.
Traders swing que quieren confluencia. Las divergencias de delta — donde el precio hace un nuevo mínimo pero el delta está subiendo — son algunas de las señales de reversión más confiables en el trading profesional. Este indicador las detecta automáticamente.
Cualquiera que opere forex, índices o commodities en cTrader con un broker que provea datos de Nivel 2. Fusion Markets, IC Markets, Go Markets y brokers ECN/STP similares proveen todos los datos DOM que este indicador lee.
Si alguna vez estuviste del lado equivocado de una vela de "alto volumen", esta es la herramienta que te dice por qué.
Lo que obtienes
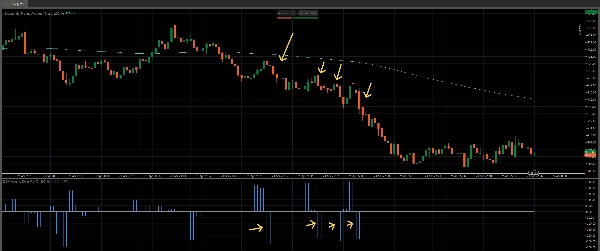
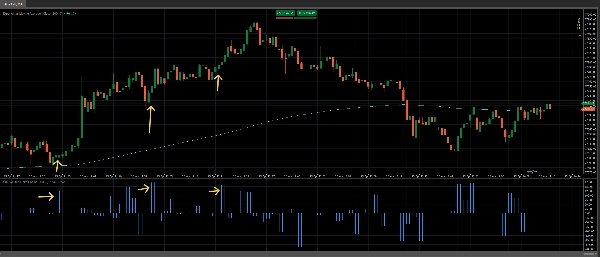
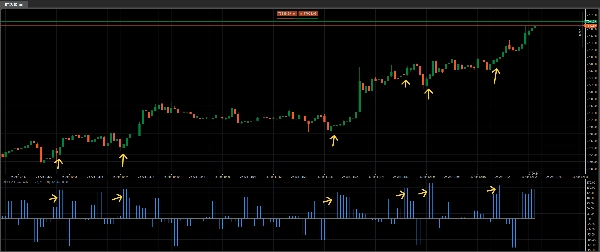
Un histograma limpio y profesional debajo de tu gráfico que muestra el delta neto para cada barra, basado en datos altamente precisos. Las barras positivas significan que los compradores dominaron. Las barras negativas significan que los vendedores dominaron. El tamaño de la barra te muestra cuánto un lado superó al otro. Usado junto con indicadores como la media móvil exponencial 200 da confluencia y configuraciones de alta probabilidad.
Sin desorden. Sin medias móviles rezagadas del volumen. Sin velas coloreadas que "estiman" compra y venta. Solo la diferencia cruda y sin filtrar entre compra agresiva y venta agresiva — calculada a partir de la fuente de datos más profunda disponible para traders minoristas.
Este indicador también ofrece la opción de usar un filtro de volumen para mostrar solo las barras que más importan. Barras de volumen agregadas si se desea.
Una mirada a la barra delta te dice lo que otros diez indicadores intentan aproximar. Consigue el tuyo ahora para cTrader. Es una decisión obvia por este bajo precio.
Combina esto con nuestro indicador Volume Profile Pro para decisiones aún mejor informadas en niveles clave: https://ctrader.com/products/4079
Mira nuestro increíble Black Box Bot aquí: https://ctrader.com/products/3241
Resumen
The indicator displays a clean histogram below the chart representing net volume delta per bar: positive bars indicate buyer dominance, negative bars indicate seller dominance, and bar size reflects the strength of that dominance. This provides traders with insight into market intent beyond total volume, revealing whether buyers or sellers controlled the price action.
It supports forex, indices, and commodities trading with brokers offering Level 2 data, such as Fusion Markets and IC Markets. Features include volume filtering and aggregated volume bars. The tool is suited for day traders, scalpers, and swing traders seeking to interpret order flow, confirm breakouts, detect divergences, and enhance decision-making with professional-level order flow data.
Valoraciones de clientes
5 | 50 % | |
4 | 50 % | |
3 | 0 % | |
2 | 0 % | |
1 | 0 % |