
IVB 2.0
مؤشر
1 عمليات الشراء
الإصدار 1.0، Aug 2025
Windows, Mac
4.3
التقييمات: 3
الوصف
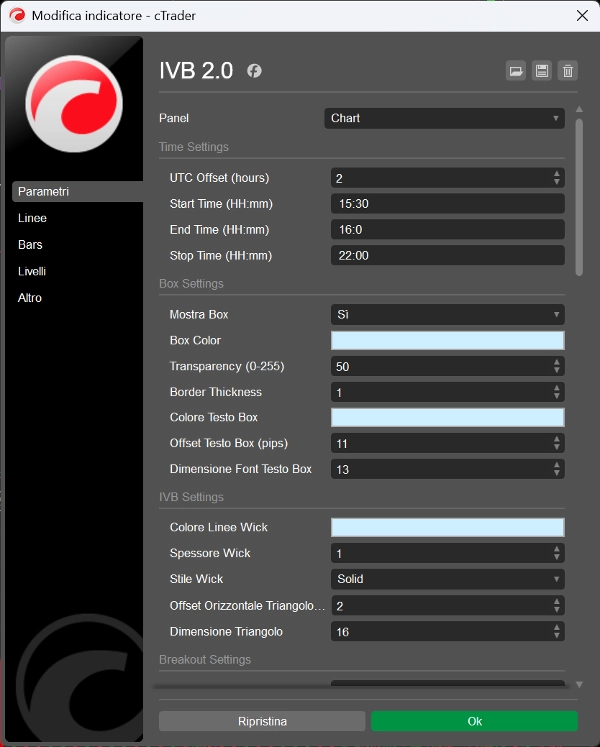
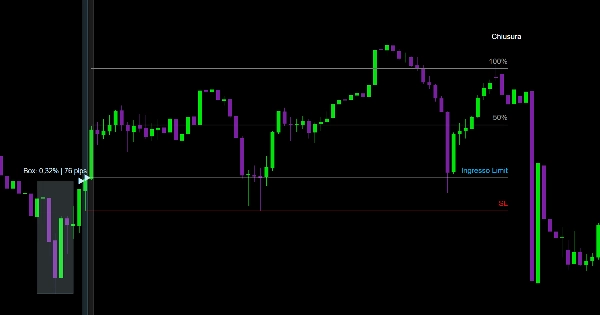
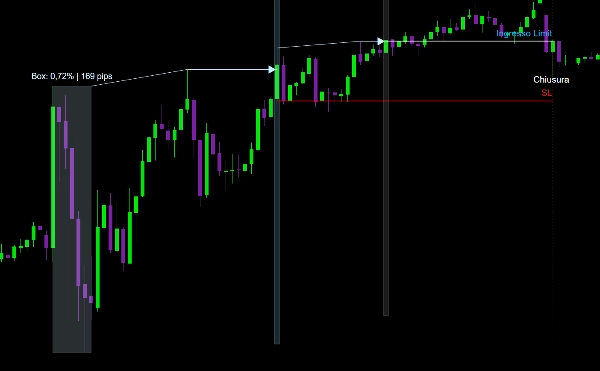
بمجرد تحديد نطاق الوقت لإنشاء صندوق التقلبات، يشير المؤشر إلى الاختراقات، ويوفر نقاط الدخول (حد أو سوق)، ووضع وقف الخسارة، ومستويات جني الأرباح عند توقعات 50%/100%/200% بمجرد أن يصبح هذا الصندوق غير متوازن، وهو قابل للتخصيص بالكامل: يمكنك تمكين أو تعطيل كل ميزة وضبط الألوان حسب تفضيلاتك.
تم تصميم هذا المؤشر لإطار زمني 5 دقائق.
الملخص
ملخص الذكاء الاصطناعي
IVB 2.0 is a trading indicator designed for use on a 5-minute timeframe, focusing on the imbalance within the maximum volatility box of indices. Users define a time range to create this volatility box, after which the indicator signals breakouts and suggests entry points using limit or market orders. It also provides guidance for placing Stop Loss and Take Profit levels at 50%, 100%, and 200% projections once the volatility box becomes imbalanced. The indicator is fully customizable, allowing users to enable or disable individual features and adjust color settings according to their preferences.
ملف تعريف المؤشر
تقييمات العملاء
4.3
التقييمات: 3
5 | 33 % | |
4 | 67 % | |
3 | 0 % | |
2 | 0 % | |
1 | 0 % |
تقييمات العملاء
September 14, 2025
September 11, 2025
the first 10 trades should stay boring. The review process gets less scattered.
August 31, 2025
مناقشة
الأسئلة الشائعة
يتم توفير المنتجات المتاحة من خلال cTrader Store، بما في ذلك روبوتات التداول والمؤشرات والإضافات، من قبل مطوري الطرف الثالث وإتاحتها لأغراض الوصول المعلوماتي والفني فقط. cTrader Store ليس وسيطًا ولا يقدم نصائح استثمارية أو توصيات شخصية أو أي ضمان للأداء المستقبلي.


السعر
منذ 20/08/2025
1
المبيعات