
الوصف
الجلسات بواسطة [BeyondTrading] — اعرف أين كان السوق.
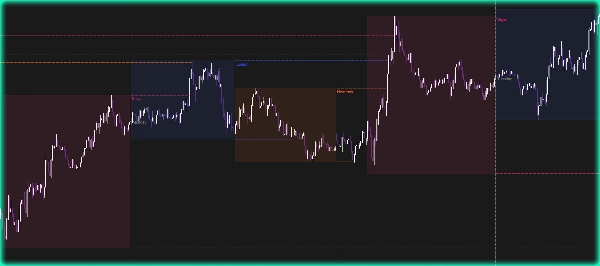
تصور الجلسات الأربع الرئيسية للتداول مباشرة على الرسم البياني الخاص بك — نيويورك، لندن، طوكيو، سيدني — قابلة للتخصيص بالكامل في اللون والوقت والشفافية. كل جلسة ترسم مربع نطاق حي يتوسع في الوقت الحقيقي مع تحرك السعر، لذا تعرف دائمًا النطاق الذي يتم بناؤه.
عندما تغلق الجلسة، يتم تلقائيًا إسقاط الأعلى والأدنى إلى الأمام كخطوط متقطعة. تبقى هذه المستويات نشطة حتى يكسر السعر إياها — ثم تتوقف. لا فوضى، لا تخمين. ترى بالضبط أي المستويات لا تزال حية وأيها تم تجاوزها.
لماذا تهم مستويات الأعلى/الأدنى للجلسة
الأعلى والأدنى للجلسات هي تجمعات سيولة رئيسية. المؤسسات وصناع السوق يعودون باستمرار إلى هذه المستويات إما للانعكاس أو لجمع السيولة قبل حركة حقيقية. أعلى لندن السابق ليس مجرد خط — إنه المكان الذي توجد فيه أوامر الإيقاف، حيث يُحتجز المتداولون عند الاختراق، وحيث يأتي المال الذكي للصيد قبل الانعكاس. مع التمديد التلقائي والكشف الفوري عن الاختراق، تعرف دائمًا أي المستويات لا تزال في اللعب ومن المحتمل أن تثير رد فعل.
الميزات
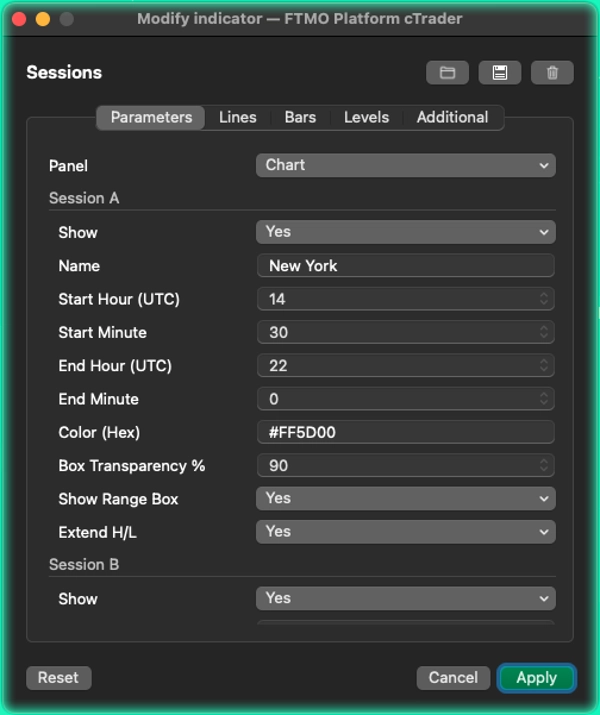
- 4 جلسات قابلة للتكوين بالكامل مع وقت بدء/انتهاء مخصص، لون سداسي، وشفافية.
- مربع نطاق حي يتم تحديثه مع كل شريط.
- الأعلى والأدنى يتم إسقاطهما إلى الأمام بعد إغلاق الجلسة، ويتم إزالتهما تلقائيًا عند الاختراق.
- حد أقصى قابل للتكوين للمستويات النشطة للحفاظ على نظافة الرسم البياني.
- فاصل عمودي يومي مع تسمية يوم الأسبوع.
- يعمل مع الجلسات الليلية مثل سيدني.
الملخص
تقييمات العملاء
5 | 100 % | |
4 | 0 % | |
3 | 0 % | |
2 | 0 % | |
1 | 0 % |


