
الوصف
نظرة عامة
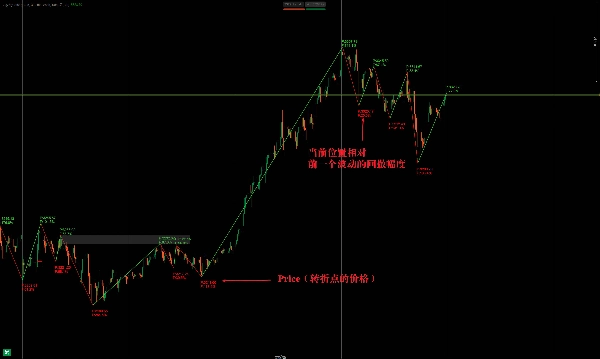
مؤشر ZigZag هو أداة تحليل فني تُستخدم بشكل أساسي لتحديد نقاط انعكاس السعر الرئيسية من خلال تصفية ضوضاء السوق. يربط بين القمم والقيعان المهمة بخطوط ZigZag، مما يساعد المتداولين على تصور الاتجاهات والاختراقات المحتملة.
كيف يعمل ZigZag
- الوظيفة الأساسية
-
- يقوم بإزالة تقلبات السعر الطفيفة عن طريق تعيين عتبة تغير سعر دنيا (نسبة مئوية أو قيمة ثابتة).
- يربط فقط بين القمم/القيعان الهامة، مما يبسط تحليل الاتجاه.
- يُستخدم غالبًا لاكتشاف مستويات الدعم/المقاومة، والانعكاسات (مثل الرأس والكتفين، القمم/القيعان المزدوجة).
- المعلمات الرئيسية
-
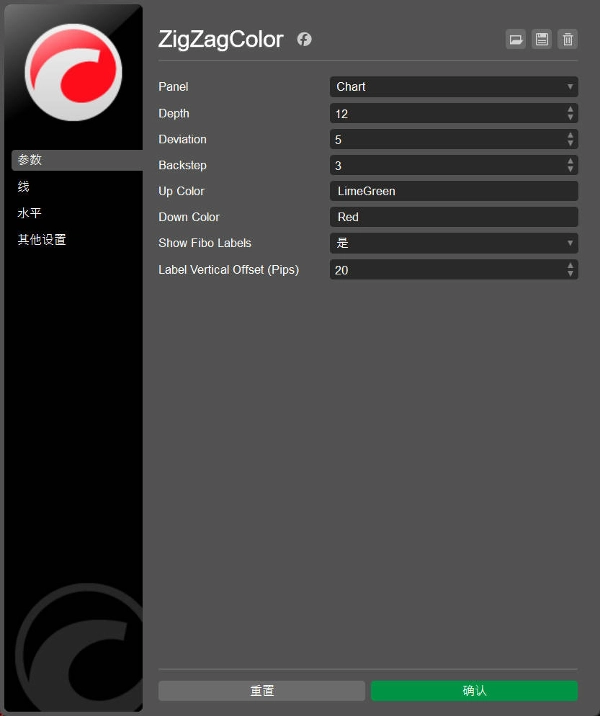
- أدنى حركة سعر (%): تحدد الحساسية (مثلاً، 5% يتجاهل الحركات الأصغر من ذلك).
- عمق الرجوع: يتحكم في عدد الشموع السابقة التي يتم تحليلها، مما يؤثر على التأخير.
التطبيقات الأساسية
1. تحديد الاتجاه
- الاتجاهات الصاعدة: قمم أعلى (HH) + قيعان أعلى (HL).
- الاتجاهات الهابطة: قمم أدنى (LH) + قيعان أدنى (LL).
- يساعد في رسم خطوط الاتجاه لصفقات الاختراق المحتملة.
2. التعرف على الأنماط
- يكشف عن أنماط الرسم البياني الكلاسيكية (مثل المثلثات، الأعلام، الأوتاد) من خلال تحديد نقاط التأرجح.
3. مستويات تصحيح فيبوناتشي
- يحدد قمم/قيعان واضحة لـ امتدادات فيبوناتشي أو تصحيحات.
4. اكتشاف التباعد
- يسلط الضوء على التباعد بين السعر والمؤشرات (RSI، MACD).
مؤشر ZigZag هو أداة تحليل فني تُستخدم بشكل رئيسي لتحديد نقاط التحول الرئيسية في اتجاه السعر، مما يساعد المتداولين على تصفية ضوضاء السوق وتسليط الضوء على القمم والقيعان المهمة. فيما يلي النقاط الأساسية وطريقة استخدامه:
مبدأ عمل ZigZag
- الوظيفة الأساسية:
-
- يتجاهل تلقائيًا التقلبات الصغيرة من خلال تعيين عتبة لتغير السعر (نسبة مئوية أو قيمة ثابتة)، ويربط فقط القمم والقيعان البارزة لتشكيل خطوط متعرجة (شكل ZigZag).
- يُستخدم غالبًا للمساعدة في تحديد مستويات الدعم/المقاومة، وانعكاسات الاتجاه (مثل الرأس والكتفين، القيعان المزدوجة، وغيرها من الأشكال).
- المعلمات الأساسية:
-
- أدنى نطاق حركة (مثل 5% أو نقاط): يحدد حساسية تصفية التقلبات الصغيرة. كلما زادت القيمة، قلت الإشارات لكنها أصبحت أكثر موثوقية.
- عمق الرجوع: يتحكم في عدد الشموع المرجعية المستخدمة في الحساب، مما يؤثر على تأخير نقاط الانعكاس.
الاستخدامات الرئيسية
- تحديد الاتجاه:
-
- تحديد اتجاه الاتجاه من خلال ارتفاع القمم المتتالية (اتجاه صاعد) أو انخفاض القيعان المتتالية (اتجاه هابط).
- بالاقتران مع خطوط الاتجاه، يمكن التنبؤ بالاختراقات أو التصحيحات مقدمًا.
- تحليل الأنماط:
-
- التعرف على أنماط السعر الكلاسيكية (مثل المثلثات، الأعلام)، حيث تعرض خطوط ZigZag بوضوح حدود الأنماط.
- التكامل مع أدوات فيبوناتشي:
-
- تستخدم قمم وقيعان الموجات المحددة بواسطة ZigZag كنقاط بداية/نهاية لتصحيحات أو امتدادات فيبوناتشي.
- كشف التباعد:
-
- عندما يحدث تباعد بين السعر والمؤشرات (مثل RSI، MACD)، يساعد ZigZag في تأكيد نقاط بداية ونهاية التباعد.
الملخص
ملف تعريف المؤشر
تقييمات العملاء
0.0
التقييمات: 0
تقييمات العملاء
لا توجد تقييمات لهذا المنتج حتى الآن. هل جرَّبته بالفعل؟ كن أول من يخبر الآخرين!
مناقشة
الأسئلة الشائعة
Prop
Forex
Breakout
Indices
Commodities
RSI
Crypto
Stocks
MACD
يتم توفير المنتجات المتاحة من خلال cTrader Store، بما في ذلك روبوتات التداول والمؤشرات والإضافات، من قبل مطوري الطرف الثالث وإتاحتها لأغراض الوصول المعلوماتي والفني فقط. cTrader Store ليس وسيطًا ولا يقدم نصائح استثمارية أو توصيات شخصية أو أي ضمان للأداء المستقبلي.


السعر
منذ 30/09/2024
44
المبيعات