
الوصف
🚀 نظام اختراق القناة
هذا الخوارزمية المتخصصة مصممة لـ تأكيد نقاط الدخول والخروج بدقة 🎯 من خلال دمج عدة عناصر من التحليل الفني لتوفير إشارات موثوقة.
🔍 كيف يعمل؟
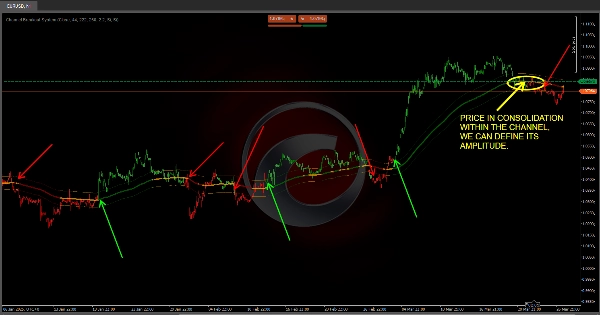
📊 القناة القائمة على التقلب (ATR)
✅ يتم حساب تقلب السوق باستخدام ATR (المتوسط الحقيقي المدى) 📉.
✅ يتم تعديل "المتوسط المتحرك للاتجاه" بإضافة وطرح قيمة تتناسب مع هذا التقلب، مكونًا خطين منقطين يعملان كـ "سقف" و"أرضية" للسوق.
✅ ماذا يعني هذا لك؟ إذا بقي السعر داخل القناة، قد يكون السوق في مرحلة تذبذب أو تجميع؛ وإذا اخترق بوضوح، فهذه إشارة إلى حركة اتجاه قوية 📈📉.
✅ قابل للتخصيص بالكامل! قم بضبط إعدادات القناة لتتناسب مع استراتيجيتك 📌.
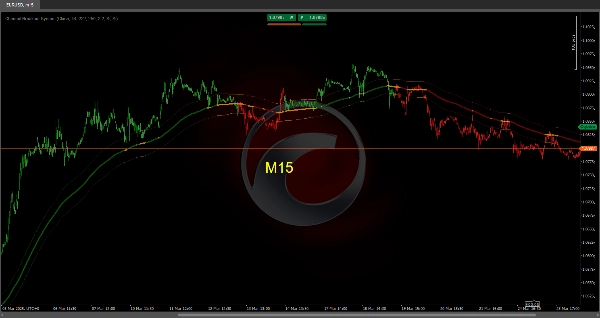
🟢 كشف الاتجاه بألوان ذكية
🔹 المؤشر يقارن موقع المتوسط المتحرك السريع مع المتوسط المتحرك المتوسط، وكلاهما بالنسبة إلى المتوسط المتحرك للاتجاه.
🔹 بناءً على مرحلة السوق، تتغير ألوان الشموع:
- 🟢 أخضر → مرحلة سوق صاعدة.
- 🔴 أحمر → مرحلة سوق هابطة.
- 🟠 برتقالي أو محايد → احتمال التجميع أو عدم اليقين.
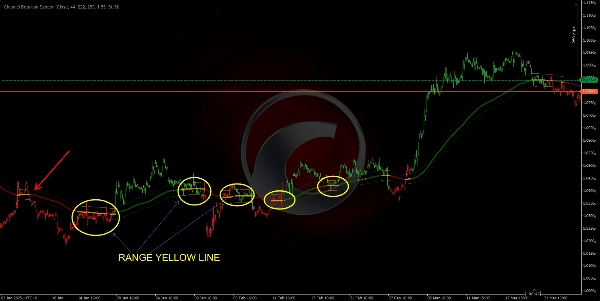
🔹 إذا كان السعر والمتوسطات المتحركة "محاصرين" داخل القناة، فهذا يشير إلى مرحلة تجميع، مما يساعدك على تجنب التداول في مناطق غير حاسمة.
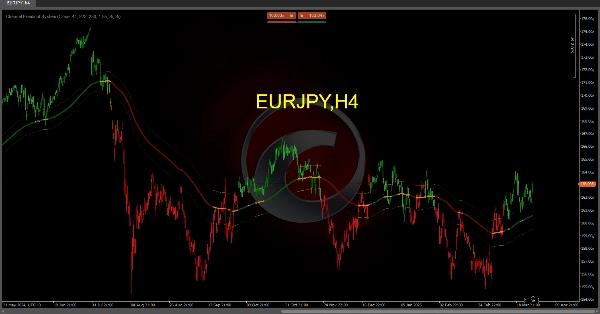
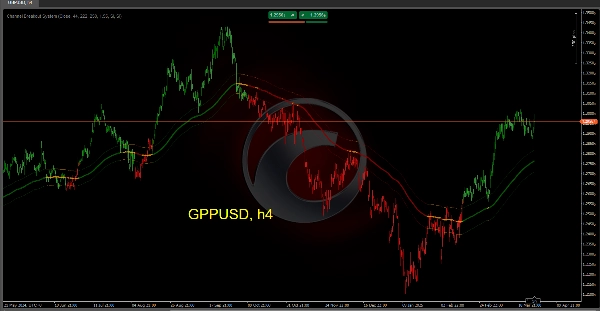
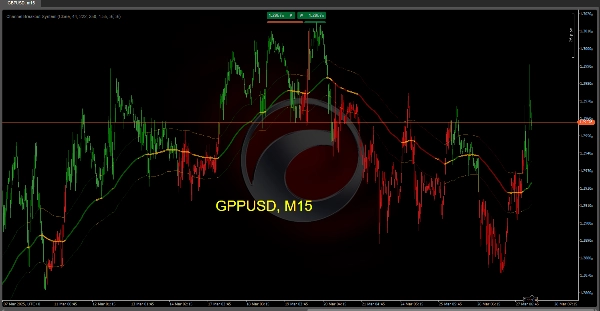
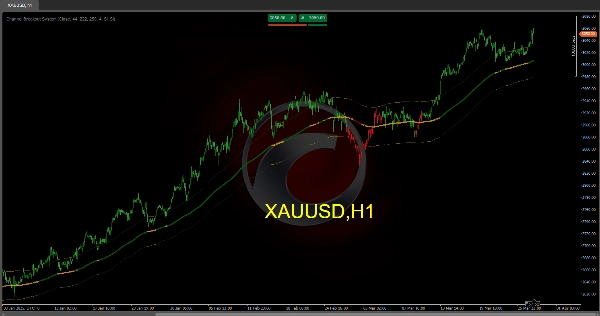
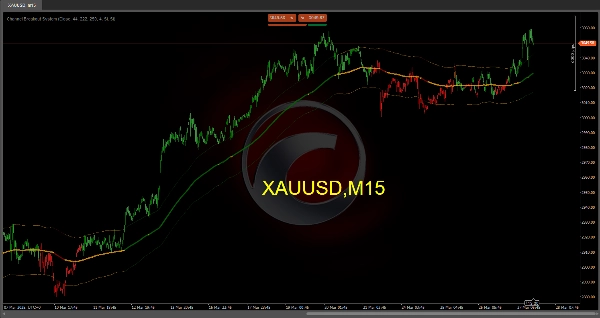
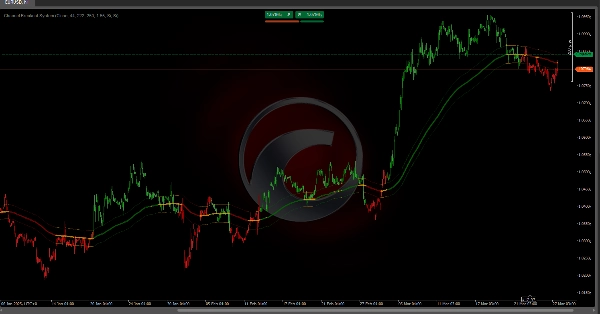
🎯 كيف يبدو على الرسم البياني
🔵 خط الاتجاه الرئيسي: يتغير لونه حسب اتجاه السوق (أخضر، أحمر، أو برتقالي).
📏 القناة المنقطة: تعكس نطاق السوق بناءً على التقلب.
📊 الأشرطة الملونة: توفر تمثيلًا بصريًا سهلاً للمرحلة الحالية للسوق.
🚀 لماذا تستخدم هذا النظام؟
✔ يحدد بسرعة ما إذا كان السوق في اتجاه أو في نطاق.
✔ يسلط الضوء بصريًا على قوة واتجاه الاتجاه.
✔ يتوقع الانعكاسات المحتملة مع إشارات واضحة للاختراق والتقاطع.
✔ يؤكد نقاط الدخول والخروج، مما يقلل الإشارات الخاطئة ويحسن دقة التداول.
🔹 حسّن تداولك وتداول بثقة أكبر باستخدام نظام اختراق القناة 🏆. استعد لاكتشاف أفضل فرص السوق! 📈🔥
مؤشرات متجر Ctrader:
هيكل السوق الديناميكي
تحليل نقاط الانعطاف
فيبوناتشي الخطي
انحدار متعدد الأطر الزمنية
انحياز الشمعة متعدد المستويات
المتعقب
خطوط الدعم والمقاومة التلقائية
للاتجاه
الملخص
The system features smart color-coded trend detection by comparing fast, medium, and trend MAs, with candles changing color to indicate market phases: green for bullish, red for bearish, and orange for consolidation or uncertainty. This visual aid helps identify trend strength, direction, and potential consolidation zones.
On the chart, the main trend line changes color based on market direction, the dotted channel reflects volatility-based range, and colored bars provide an easy visual representation of the current market phase.
The indicator is fully customizable to fit different trading strategies. It aims to quickly identify trending or ranging markets, anticipate potential reversals with breakout and crossover signals, and confirm entry and exit points to reduce false signals and improve trade accuracy.
تقييمات العملاء
5 | 33 % | |
4 | 67 % | |
3 | 0 % | |
2 | 0 % | |
1 | 0 % |


