
الوصف
مؤشرات متجر Pinescriptlabs: متجر Pinescriptlabs cBots : (cBot) اختراق الذهب و BTCنقاط محورية للجلسة(جديد)
هيكل السوق المتقدم: Bos, Choch, SwinLevels, كتل الأوامر، مكتشف هيكل السوق والسيولة (جديد)
خوارزمية ذكية متتبعة (جديد)
دعم ومقاومة SmartTrend
خطوط
Lines
تحليل
هيكل السوق الديناميكي
لـ
نقاط
الانعطاف
انحدار خطي فيبوناتشي
متعدد الأطر الزمنية
Regression
متعدد المستويات
متعصب الشمعة
المتعقب
دعم ومقاومة
اتجاه تلقائي
خطوط
Lines
جميع
مستويات الدعم و
المقاومة
المستويات
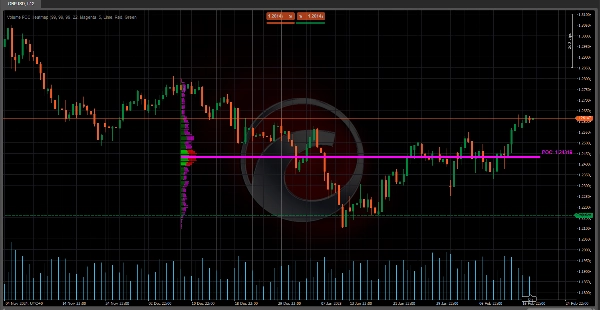
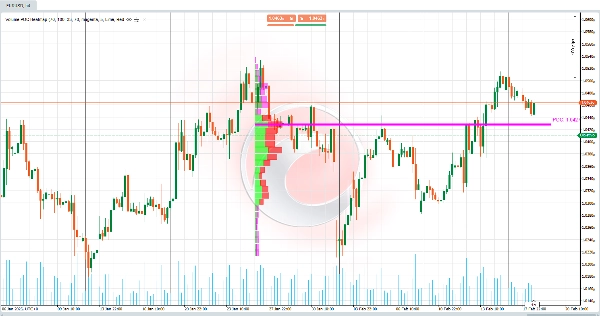
🔥 خريطة حرارة حجم POC 🔥
هذا المؤشر هو ملف حجم يعرض توزيع حجم التداول عبر مستويات سعر مختلفة خلال فترة محددة. الهدف الرئيسي منه هو تحديد مناطق الدعم/المقاومة الرئيسية والمناطق التي أظهر فيها السوق أكبر اهتمام (نشاط شراء/بيع مرتفع). إنه مفيد جدًا لـ:
- كشف نقطة التحكم (POC) 🎯
مستوى السعر الذي يحتوي على أعلى حجم، يعمل كمغناطيس لحركة السعر. - تصوير منطقة القيمة (VA)
المنطقة التي يتركز فيها نسبة محددة من إجمالي الحجم (مثلاً، 70%)، مما يشير إلى توازن بين المشترين والبائعين. - تمييز حجم الشراء والبيع 📈📉
يُظهر أين يتراكم ضغط الشراء مقابل ضغط البيع.
🧠 المنطق والحسابات الرئيسية 🔢
- تقسيم نطاق السعر 📏
-
- نطاق السعر (من الأدنى إلى الأعلى في آخر B Bars ) يُقسم إلى خلايا حجم (CNum) .
مثال: إذا كان CNum = 33 ، يتم تقسيم النطاق إلى 33 مستوى متساوي المسافة.
- نطاق السعر (من الأدنى إلى الأعلى في آخر B Bars ) يُقسم إلى خلايا حجم (CNum) .
- توزيع الحجم حسب المستوى 📊
-
- لكل شريط في البيانات التاريخية:
-
- يتم حساب الحجم المرتبط بالجسم (الفرق بين الافتتاح والإغلاق) والفتائل (الارتفاعات والانخفاضات).
- يتم توزيع الحجم تناسبيًا عبر خلايا السعر التي يتقاطع معها الشريط.
مثال: إذا غطى شريط أخضر (صاعد) 3 خلايا، يتم تخصيص الحجم بشكل رئيسي لتلك الخلايا كـ "حجم صاعد".
- حساب نقطة التحكم (POC) 🎯
-
- POC هي الخلية التي تحتوي على أعلى حجم متراكم، وتمثل السعر الذي كان هناك أكبر توافق بين المشترين والبائعين.
- حساب منطقة القيمة (VA) 🔄
-
- تمتد من POC صعودًا/هبوطًا حتى تشمل النسبة المحددة من إجمالي الحجم (مثلاً، 70%).
مثال: إذا كانت VA تتراوح من 100 إلى 105 ، فهذا يعني أن 70% من الحجم تم تداوله ضمن هذا النطاق.
- تمتد من POC صعودًا/هبوطًا حتى تشمل النسبة المحددة من إجمالي الحجم (مثلاً، 70%).
- التطبيع البصري 🖼️
-
- يتم تحجيم الأحجام باستخدام عامل المقياس لتعديل عرض الأشرطة على الرسم البياني، مما يسهل التصور.
🛠️ مفتاح خريطة حرارة حجم POC 💡
- نقص السياق في مؤشرات الحجم التقليدية 🤔
مؤشرات الحجم الكلاسيكية (مثل حجم كل شريط) لا تظهر أين تم التداول بالحجم. هذا المؤشر يرسم الحجم حسب مستوى السعر، مما يحل هذه المشكلة. - تحديد الدعم/المقاومة العضوي 🚀
المناطق ذات الحجم العالي تعمل كدعم/مقاومة ديناميكي، أكثر موثوقية من الخطوط الثابتة. - كشف الاختلالات ⚖️
المناطق التي تحتوي على حجم صعودي أو هبوطي بشكل رئيسي تشير إلى احتمالية حدوث اختراقات أو انعكاسات.
💡 الاستخدام العملي في التداول 📈
- POC كمنطقة اهتمام 🎯
-
- إذا اقترب السعر من POC، توقع ردود فعل مثل الارتدادات أو التماسك.
- منطقة القيمة (VA) كمنطقة توازن 🔄
-
- إذا كان السعر خارج VA، فإنه يميل إلى العودة إليها (تأثير مغناطيسي).
- إذا كان السعر داخل VA، فقد يشير ذلك إلى التماسك.
- حجم الشراء/البيع كتأكيد 🔍
-
- ارتفاع في حجم الشراء عند المقاومة يشير إلى احتمال حدوث اختراق.
- حجم بيع مرتفع عند الدعم يشير إلى احتمال حدوث انهيار.
🌟 مثال 📊
المعلمات المستخدمة (مرئية وقابلة للتكوين من قبل المستخدم):
- عدد الأشرطة السابقة = 55 → عدد الأشرطة التاريخية التي تم تحليلها.
- خلايا الحجم = 33 → عدد التقسيمات/الخلايا في نطاق السعر.
- نسبة حجم منطقة القيمة = 70 → نسبة الحجم التي تحدد منطقة القيمة.
الوضع:
- يكسر السعر مستوى دعم فني، لكن الحجم في تلك المنطقة منخفض (وفقًا للملف).
- لاحقًا، يعود السعر إلى منطقة القيمة (VA) المحددة بنسبة 70% من إجمالي الحجم.
التفسير:
- كان الاختراق زائفًا (بسبب انخفاض الحجم في منطقة الاختراق).
- يسعى السوق لإعادة التوازن داخل منطقة القيمة ، حيث يوجد نشاط أعلى (كثافة حجم مرتفعة).
الإجراء:
- ابحث عن فرص شراء بالقرب من الحد الأدنى لـ VA أو POC، حيث تعتبر هذه مناطق ذات اهتمام عالي للمشاركين في السوق.
الملخص
Key functionalities include:
- Division of the price range into multiple volume cells for detailed volume mapping.
- Calculation of POC as the volume consensus price.
- Determination of the Value Area around the POC.
- Visual normalization of volume bars for clearer chart representation.
This tool addresses the limitation of traditional volume indicators by showing where volume was traded rather than just total volume per bar. It helps identify dynamic support and resistance zones based on volume concentration and detects volume imbalances that may signal potential breakouts or reversals. Traders can use it to anticipate price reactions near the POC and VA, aiding in decision-making for entries and exits. Configurable parameters include the number of historical bars analyzed, volume cells, and the percentage defining the Value Area.
تقييمات العملاء
5 | 100 % | |
4 | 0 % | |
3 | 0 % | |
2 | 0 % | |
1 | 0 % |