
Açıklama
Pinescriptlabs Store göstergeleri: Pinescriptlabs Store cBotları : (cBot) Gold & BTC BreakoutOturum Pivotları(yeni)
Gelişmiş Piyasa Yapısı: Bos, Choch, SwinLevels, Emir Blokları, Piyasa Yapısı & Likidite Bulucu (Yeni)
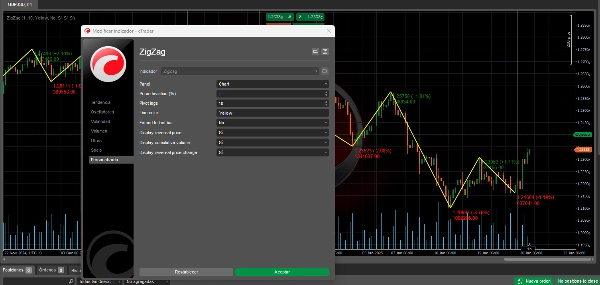
ZigZag Fiyat Likidite Projeksiyonu
Akıllı Takip Algoritması (yeni)
AkıllıTrend Destek &
Direnç
Çizgileri
Dinamik
Piyasa Yapısı
Analizi
Dönüş
Noktaları
Fibonacci
Lineer
Regresyon
Çoklu Zaman Dilimi
Çok Katmanlı
Mum Yönü
Takipçisi
Otomatik
Destek ve
Direnç
Trend
Çizgileri
Tüm
Destek ve
Direnç
Seviyeleri
ZigZag Göstergesi: Piyasa Trendlerini Basitleştirmek 📉📈
ZigZag, küçük piyasa hareketlerini filtreleyerek bir varlıktaki önemli trend değişikliklerini tanımlamaya yardımcı olan teknik bir göstergedir. Temel amacı, küçük dalgalanmaların "gürültüsünü" ortadan kaldırarak görsel fiyat analizini basitleştirmektir.
Nasıl Çalışır ⚙️
- 📊 Önemli dönüş noktalarını (pivotları) bulmak için fiyatları analiz eder.
- 📈 Bir dönüş noktası, fiyat belirli bir minimum yüzde değiştiğinde (sapma parametresi) önemli kabul edilir.
- 🔗 Bu dönüş noktalarını düz çizgilerle bağlayarak "zigzag" deseni oluşturur.
- 🕒 Yeni fiyat verileri geldikçe dinamik olarak güncellenir.
Ticaret Kullanımı 💡
Trend Tanımlama 📐
- 🔍 Ana piyasa yönünü görselleştirmeye yardımcı olur.
- 🚀 Boğa ve ayı trendlerini tespit etmeyi kolaylaştırır.
- 📏 Ana destek ve direnç seviyelerini net bir şekilde vurgular.
Desen Analizi 📋
- 🎯 Grafik desenlerinin tanımlanmasını basitleştirir.
- 🕵️♂️ Üçgenler, bayraklar ve diğer desenler gibi fiyat oluşumlarını vurgular.
- 🌊 Elliott dalgalarını tanımada netliği artırır.
Ticaret Yönetimi 🎛️
- 🎯 Potansiyel giriş ve çıkış noktalarını belirler.
- 🛡️ Önceki pivotlara dayanarak stop-loss seviyelerinin belirlenmesine yardımcı olur.
- 🎯 Gerçekçi fiyat hedeflerinin belirlenmesini kolaylaştırır.
Volatilite Analizi 🌡️
- 📏 Pivotlar arasındaki mesafe piyasa volatilitesini yansıtır.
- 🧩 Hareketlerin büyüklüğüne göre stratejilerin ayarlanmasına yardımcı olur.
- ⏳ Konsolidasyon dönemleri ile yönlü trendleri ayırt eder.
Sinyal Onayı ✅
- 🔍 Diğer göstergeler için bir onay aracı olarak hizmet eder.
- 🚪 Ana seviyelerin kırılımlarını doğrular.
- 🔗 Daha sağlam stratejiler için diğer göstergelerle birleştirilebilir.
Önemli Hususlar 🧠
Geriye Dönük 📅
- ⏪ Pivot noktaları hareket gerçekleştikten sonra onaylanır.
- 🔮 Kendi başına öngörücü değildir.
- ⚖️ Karar verme için diğer göstergelerle birlikte kullanılmalıdır.
Parametre Ayarları 🔧
- 🎚️ Hassasiyet, ayarlanan sapma yüzdesine bağlıdır.
- 🔍 Daha küçük bir yüzde daha fazla pivot noktası gösterir.
- 🧹 Daha yüksek bir yüzde küçük hareketleri filtreler, sadece önemli değişiklikleri gösterir.
Zaman Dilimi Kullanımı 🕒
- 🕰️ Herhangi bir zaman diliminde çalışır.
- 🔄 Parametreler ticaret ufuklarına göre ayarlanmalıdır.
- 🌐 Birden fazla zaman diliminde analiz daha kapsamlı bir görüş sunar.
📈 ZigZag göstergesini analizleri basitleştirmek, trendleri tanımlamak ve ticaret yolculuğunuzda karar vermeyi geliştirmek için güçlü bir araç olarak kullanın! 🚀
Özet
Key functionalities include:
- Trend Identification: Visualizes primary market direction, highlights bullish and bearish trends, and marks key support and resistance levels.
- Pattern Analysis: Simplifies recognition of chart patterns such as triangles, flags, and Elliott waves.
- Trade Management: Assists in identifying entry and exit points, setting stop-loss levels based on previous pivots, and establishing realistic price targets.
- Volatility Analysis: Reflects market volatility through pivot distances, aiding strategy adjustments and distinguishing consolidation from trending phases.
- Signal Confirmation: Validates breakouts and complements other indicators for robust trading strategies.
The indicator is retrospective, confirming pivots only after price movements occur, and is not predictive on its own. Sensitivity can be adjusted via the deviation percentage to show more or fewer pivot points. It is compatible with any timeframe and benefits from multi-timeframe analysis for comprehensive market views.
This tool supports analysis across various markets including cryptocurrencies (BTCUSD), commodities (XAUUSD), and others, and integrates with related indicators like RSI, ATR, and Supertrend.
Müşteri değerlendirmeleri
5 | 50 % | |
4 | 33 % | |
3 | 17 % | |
2 | 0 % | |
1 | 0 % |


!["[CB] Pivot Points Pro" logosu](https://cdn.ctrader.com/image/webp/43463c82-67b0-4f10-a4ba-901bba091d81_32594)