
Açıklama
Yeni yatırımcıların yaptığı en büyük hatalardan biri, çok fazla gösterge ekleyerek bir grafik üzerinde mümkün olduğunca çok bilgi oluşturmaya çalışmalarıdır ve sonuç, yatırımcıya çelişkili bir hikaye anlatan çizgiler ve verilerle dolu bir gürültü grafiğidir.
Artılar:
- Dönüşleri tespit etmede şaşırtıcı doğruluk.
- Görsel olarak hoş ve piyasa koşullarını kolayca görme.
- Trend ticareti göstergesi veya karşı trend ticareti göstergesi olarak kullanılabilir.
- Güçlü geri test sonuçları (~Aşırı sinyallerde %95 doğruluk).
Eksiler:
- Aşırı Alım "Aşırı" ve Aşırı Satım "Aşırı" koşullarında bile, gösterge bazen çok güçlü bir trendin ters yönünde işlem yapmanıza neden olabilir ve fiyat sonunda döndüğünde büyük zararlar yaşanabilir.
- 15 dakikalık zaman dilimi ve üzeri işlemlerde Aşırı Alım "Aşırı" ve Aşırı Satım "Aşırı" sinyalleri nadir olabilir. Bunu dengelemek için, sık sık Aşırı sinyaller almak adına en az 8 Majör paritede işlem yapmanız önerilir.
Chaos Reversals Nasıl Kullanılır
Chaos kullanarak basit ve kazandıran bir sistem, Haftalık ve Günlük Destek ve Direnç çizgilerini işaretleyip, 15 dakikalık Chaos'un Aşırı Alım ve Aşırı Satım sinyallerini kullanarak bu destek ve direnç çizgilerinden yaklaşan sıçramalara karşı trend ticareti yapmaktır.
Sinyaller şu şekilde üretilir:
- Hızlı W%R önce hareket eder, ardından yavaş W%R gelir.
- Tek hızlı W%R Aşırı Satım veya Aşırı Alım olduğunda, bu dönüşleri scalping yapabilirsiniz.
- Hem hızlı hem de yavaş W%R Aşırı Satım veya Aşırı Alım olduğunda, bu piyasanın önemli ölçüde döneceğini gösterir.
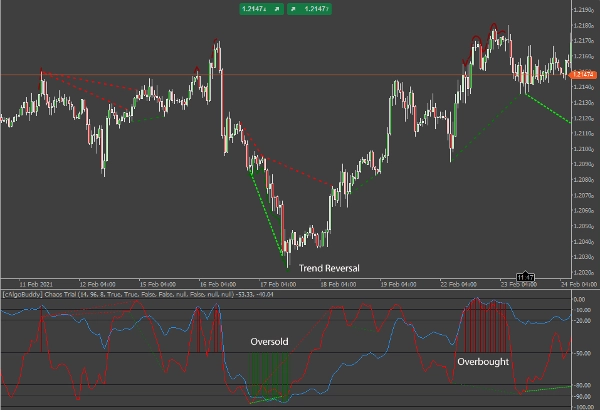
Gösterge, fiyat grafiğinde dipler veya zirveler üzerinde kırmızı veya yeşil bir çizgi çizer ve ayrıca aşırı aşırı satım veya aşırı alım koşullarını işaretlemek için gösterge alanında kırmızı veya yeşil çizgiler çizer. Bunu gösterge seçeneklerinden devre dışı bırakabilirsiniz.
Diverjansları Tespit Etme
W%R bir osilatör olduğundan, bize diverjansları tespit etme ve işlem yapma fırsatı verir. İki ana Diverjans türü vardır: Düzenli ve Gizli.
- Düzenli diverjans, fiyat yönünde bir dönüşün göstergesidir.
- Gizli diverjans, fiyat yönünde devamın göstergesidir.
Her ana tür içinde, ikincil bir sınıflandırma vardır: Ayı (Negatif) ve Boğa (Pozitif).
- Ayı diverjansı, gösterge düşerken fiyatın yükselmesi veya yatay seyretmesi durumunda oluşur.
- Boğa diverjansı, gösterge yükselirken fiyatın düşmesi veya yatay seyretmesi durumunda oluşur.
Düzenli Diverjans
Düzenli Diverjans en basit haliyle şöyledir:
- Fiyat daha yüksek zirveler yaparken, W%R hızlı çizgisi daha düşük zirveler yapıyor: Potansiyel Kısa pozisyon.
- Fiyat daha düşük dipler yaparken, W%R hızlı çizgisi daha yüksek dipler yapıyor: potansiyel Uzun pozisyon.
Her iki durumda da, yatırımcı fiyat hareketinde potansiyel bir dönüş arar.
Düzenli diverjans, mevcut Swing High veya Swing Low'un önceki mevcut Swing High veya Swing Low ile karşılaştırılması olarak en iyi şekilde kullanılır. Düzenli diverjans ile trend zayıflamakta ve piyasa duyarlılığı ters yöne kaymaktadır. Yatırımcılar, avantajlı bir dönüş veya düzeltme için hazırlık yapabilirler.
Chaos Reversals'da düzenli diverjans şu şekilde gösterilir:
- Boğa Düzenli Diverjans – Parlak Yeşil ince Kesikli Çizgi.
- Ayı Düzenli Diverjans – Kırmızı ince Kesikli Çizgi
NOT: Diverjans Çizgileri, onaylanmış bir diverjansı takip eden barın açılışında görünür.
Gizli Diverjans
Gizli Diverjans en basit haliyle şöyledir:
- Hızlı W%R çizgisi daha düşük dipler yaparken fiyat daha yüksek dipler yapıyor: potansiyel Uzun pozisyon.
- Hızlı W%R çizgisi daha yüksek zirveler yaparken fiyat daha düşük zirveler yapıyor: potansiyel Kısa pozisyon.
Her iki durumda da, yatırımcı fiyat hareketinde potansiyel bir devam arar.
Gizli diverjans, mevcut trende ilişkin fiyatları değerlendirmek için en iyi şekilde kullanılır. Bir geri çekilmeden sonra, fiyat genellikle trend yönünde son Swing High veya Swing Low seviyesine doğru devam eder. Gizli diverjans ile trend zayıflıyor olabilir ancak henüz tamamlanmamıştır. Aşağıda gösterildiği gibi, piyasa muhtemelen kar alımı nedeniyle geri çekilmiş ve düşüş trendine devam etmeyi planlamaktadır.
Chaos Reversals'da gizli diverjans şu şekilde gösterilir:
- Ayı Gizli Diverjans – Yeşil geniş Kesikli Çizgi
- Boğa Gizli Diverjans – Koyu Kırmızı geniş Kesikli Çizgi
Diverjans ile İşlem Yapmak
Diverjans ile işlem yaparken hızlı bir uyarı notu. Piyasanın Diverjans sinyalinin yönünde hareket etmeyebileceğini unutmayın. Diverjansın piyasa yönünde olası bir değişiklik veya devam belirtisi olduğunu anlamak önemlidir. Piyasa yönünü doğrulamak için fiyat hareketini izlemek önemlidir. Ayrıca, gösterge çizgilerini seviyelerle (aşırı alım için 0, aşırı satım için -100) karşılaştırarak Chaos Göstergesinin genel yönünü not edin.
Uyarılar ve Bildirimler
Gönderilecek sinyaller, Aşırı Alım/Aşırı Satım başlangıç ve bitişleri, aşırı pozisyonlardaki yavaş W%R zirvesi ve tüm diverjanslardır.
Telegram Uyarıları
Telegram'da bir bot ve kanal kuruluysa, Chaos Reversals göstergesi para birimi çiftindeki onaylanmış sinyaller için size mesajlar gönderecektir.
ÖNEMLİ:
Lütfen Saat Diliminizin yerel saatinize doğru ayarlandığından emin olun (uygulamanın sağ alt köşesi).
Masaüstü Uyarıları
Evet'i seçerseniz, Chaos Reversals göstergesi onaylanmış sinyaller için kişisel masaüstünüzde bir mesaj kutusu bildirimi gönderir.
E-posta Uyarıları
Bu işlevselliğin çalışması için önce cTrader'ınızı e-posta gönderebilecek şekilde yapılandırmalısınız (Ayarlar-> E-posta).
Özet
Müşteri değerlendirmeleri
5 | 100 % | |
4 | 0 % | |
3 | 0 % | |
2 | 0 % | |
1 | 0 % |


