
LT Flexible Volume Profile
Gösterge
12 satın almalar
Sürüm 1.0, Sep 2024
Windows, Mac
5.0
Değerlendirmeler: 3
Açıklama
Not: Sadece cTrader Windows üzerinde test edilmiştir.
Hacim Profili
Fiyat grafiğinde, hangi fiyatta daha fazla/az hacim (ticaret ilgisi) olduğunu göstermek için dikey bir profil çizimi.
Esnek Hacim Profili göstergesi
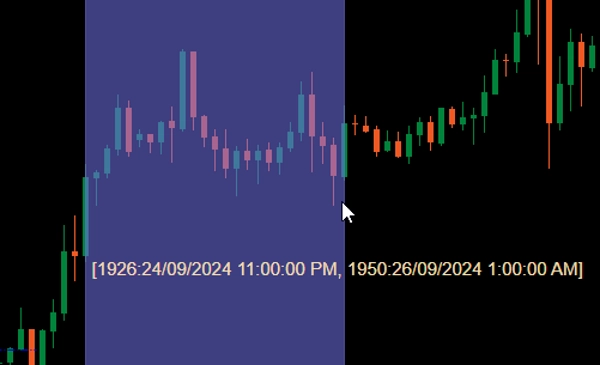
Grafiğinize eklendiğinde, fiyat grafiğinde bir alan üzerinde Ctrl tuşuna basılı tutarak sol fare tuşunu sürükleyerek o alan için profil çizdirin.
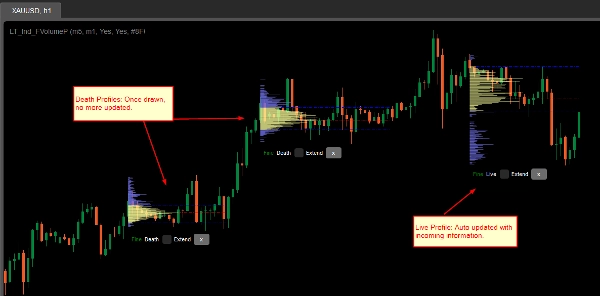
Performans açısından, profil 2 durumda çizilecektir:
- Kaba profil: Gösterge, hacim bilgisi için CoarseTF tarafından tanımlanan zaman dilimini (varsayılan m5) kullanacak, bu genellikle hızlıdır. Kaba profil gösterilirken, İnce profil arka planda yüklenecektir.
- İnce profil: Daha hassas profil, FineTF tarafından tanımlanan zaman dilimini (varsayılan m1) kullanır, ancak en ince (t1 - tek tik) olarak ayarlanabilir. Ancak, Günlük veya daha uzun zaman dilimi grafiği görüntülüyorsanız, tik zaman dilimine ayarlamak yükleme süresini artıracaktır.
Parametreler
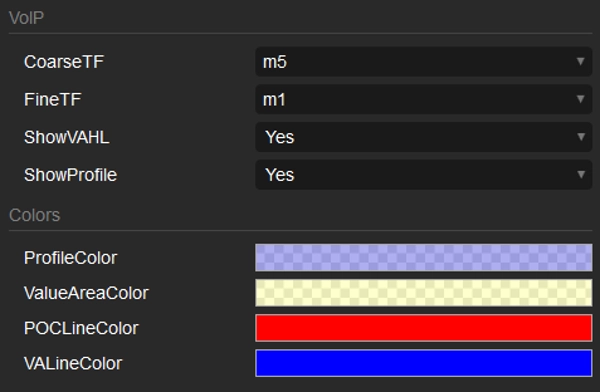
- CoarseTF: Kaba veri için zaman dilimi (varsayılan m5).
- FineTF: İnce veri için zaman dilimi (varsayılan m1).
- ShowVAHL: VAH (Değer Alanı Yüksek) ve VAL (Değer Alanı Düşük) gösterir.
- ShowProfile: Evet ise tam profili gösterir, aksi takdirde sadece VAH, VAL ve POC (Kontrol Noktası) gösterir.
- Colors: Renk özelleştirmesi.
Nasıl kullanılır
Göstergeleri fiyat grafiğinize ekledikten sonra, profili oluşturmak istediğiniz bölgeyi seçmek için Ctrl tuşuna basılı tutarak sol fare tuşunu sürükleyin ve hepsi bu kadar.
Profil oluşturulduktan sonra, profilin altında bazı bilgi/manipülasyonlar göreceksiniz:
- Kaba/İnce: Profilin durumu.
- Ölü/Canlı: Profiliniz en son barı (mum) kapsıyorsa, bu Canlı profil olup gelen bilgilerle otomatik olarak güncellenir.
- Extend onay kutusu: VAH, VAL ve POC çizgilerinin en son bara (muma) kadar uzatılması için işaretleyin
- x düğmesi: Profili grafikten kaldırmak için tıklayın.
Özet
YZ özeti
LT Flexible Volume Profile is a volume profile indicator designed for use on price charts, primarily tested on cTrader Windows. It visually represents trading volume distribution across price levels within a selected chart area, highlighting where trading interest is higher or lower.
Users activate the profile by holding Ctrl and dragging the mouse over a desired chart region. The indicator operates in two modes for performance optimization: a Coarse profile using a configurable timeframe (default 5 minutes) for faster loading, and a Fine profile using a finer timeframe (default 1 minute, with an option down to single ticks) for more precise volume data.
Key parameters include:
- CoarseTF and FineTF: timeframes for coarse and fine volume data aggregation.
- ShowVAHL: toggles display of Value Area High (VAH) and Value Area Low (VAL).
- ShowProfile: controls whether the full profile or only key levels (VAH, VAL, Point of Control) are shown.
- Colors: customizable color settings.
After rendering, the profile provides status indicators (Coarse/Fine, Live/Dead), options to extend VAH, VAL, and POC lines to the latest bar, and the ability to remove the profile. This tool supports detailed volume analysis to assist traders in identifying significant price levels based on traded volume.
Gösterge profili
Müşteri değerlendirmeleri
5.0
Değerlendirmeler: 3
5 | 100 % | |
4 | 0 % | |
3 | 0 % | |
2 | 0 % | |
1 | 0 % |
Müşteri değerlendirmeleri
October 1, 2024
Sensible product to test around volume based context. The useful part is checking participation, value areas and pressure, with the numbers checked before scaling. I would review 20 reactions near POC or VWAP before trusting the read. The data helps most when price action confirms the same zone.
September 30, 2024
September 30, 2024
Good tool for patience if the trader wants it adds useful information behind the price move. It works best as support, not a final decision maker. Volume context is stronger when POC, VWAP and value area agree across 2 sessions. volume alone can be noisy without price action.
Tartışma
SSS
Forex
cTrader Store üzerinden erişilebilen işlem botları, göstergeler ve eklentiler gibi ürünler, üçüncü taraf sağlayıcılar tarafından sağlanır ve yalnızca bilgilendirme ve teknik erişim amaçlarıyla sunulur. cTrader Store bir broker değildir ve yatırım tavsiyesi, kişisel öneriler vermez veya gelecekteki performansı garanti etmez.


Fiyat
Başlangıç 25/09/2024
34
Satışlar