
ATR Bands
Gösterge
5 satın almalar
Sürüm 1.0, Oct 2025
Windows, Mac
4.6
Değerlendirmeler: 3
Açıklama
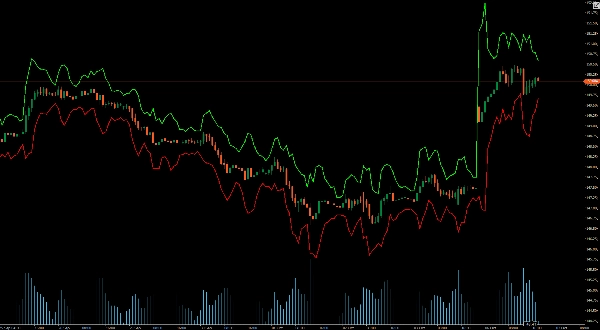
ATR Bantları fiyat grafiklerinizde dinamik olarak üst ve alt bantları gösterir.
Bu bantlar, piyasa volatilitesi hakkında gerçek zamanlı bilgiler sunar ve potansiyel kırılma ve dönüş noktalarını hassasiyetle belirlemenize yardımcı olur. Her seviyeden yatırımcı için mükemmel olan ATR Bantları, stop-loss, kar al ve giriş noktalarını optimize etmek için net görsel ipuçları sağlayarak karar verme sürecinizi geliştirir.
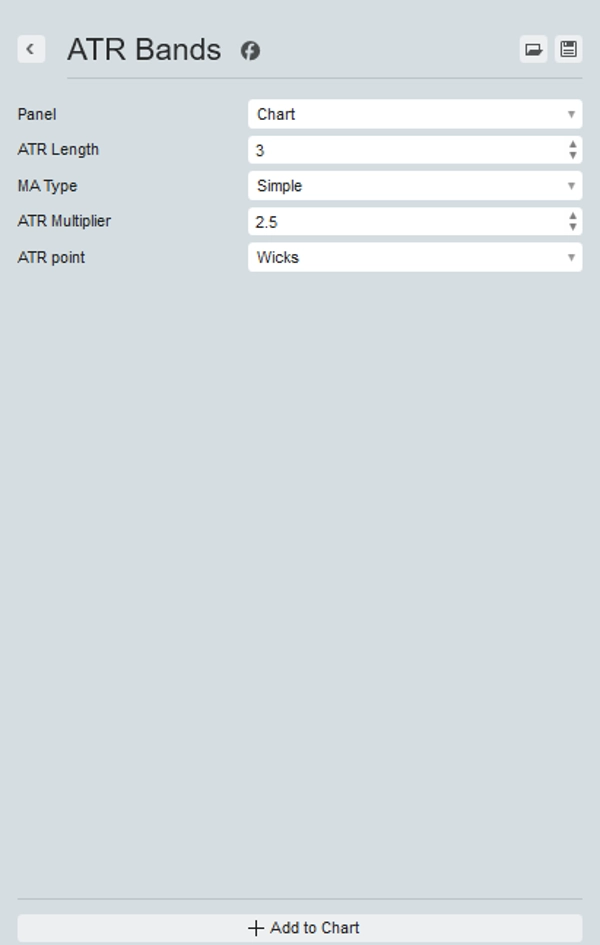
Ayarlar, tercih ettiğiniz periyodu ve çarpanı seçmenize, ATR hesaplamak için kullanılan hareketli ortalamayı değiştirmenize ve mum fitilleri veya mum kapanışını kullanmanıza olanak tanır.
Ticaret araç setinizi bugün yükseltin ve ATR Bantları ile farkı yaşayın – piyasadaki avantajınız.
Özet
YZ özeti
ATR Bands is a trading indicator that dynamically plots upper and lower bands on price charts based on the Average True Range (ATR). These bands provide real-time visualization of market volatility, assisting traders in identifying potential breakout and reversal points. The indicator supports customizable settings, including the choice of period and multiplier, selection of the moving average type used to calculate ATR, and the option to base calculations on candle wicks or candle closes. ATR Bands are applicable across various markets such as Forex, cryptocurrencies (e.g., BTCUSD), commodities, indices, and stocks. By offering clear visual cues, this tool aids in optimizing entry points, as well as setting stop-loss and take-profit levels.
Gösterge profili
Müşteri değerlendirmeleri
4.6
Değerlendirmeler: 3
5 | 67 % | |
4 | 33 % | |
3 | 0 % | |
2 | 0 % | |
1 | 0 % |
Müşteri değerlendirmeleri
October 19, 2025
weak entries have a harder time slipping through, but risk control still needs say no.
October 14, 2025
The better read comes from there is a useful pause before the click, and a few signals across sessions tell more.
October 13, 2025
Tartışma
SSS
BTCUSD
Forex
Breakout
Indices
EURUSD
Commodities
GBPUSD
NZDUSD
Prop
Crypto
Stocks
XAUUSD
NAS100
ATR
USDJPY
cTrader Store üzerinden erişilebilen işlem botları, göstergeler ve eklentiler gibi ürünler, üçüncü taraf sağlayıcılar tarafından sağlanır ve yalnızca bilgilendirme ve teknik erişim amaçlarıyla sunulur. cTrader Store bir broker değildir ve yatırım tavsiyesi, kişisel öneriler vermez veya gelecekteki performansı garanti etmez.


Fiyat
Başlangıç 25/09/2025
25
Satışlar
315
Ücretsiz yüklemeler