Açıklama
Geliştirilmiş Hareketli Ortalama göstergesini tanıtıyoruz; ticaret analizinizde daha iyi özelleştirme ve esneklik için tasarlandı.
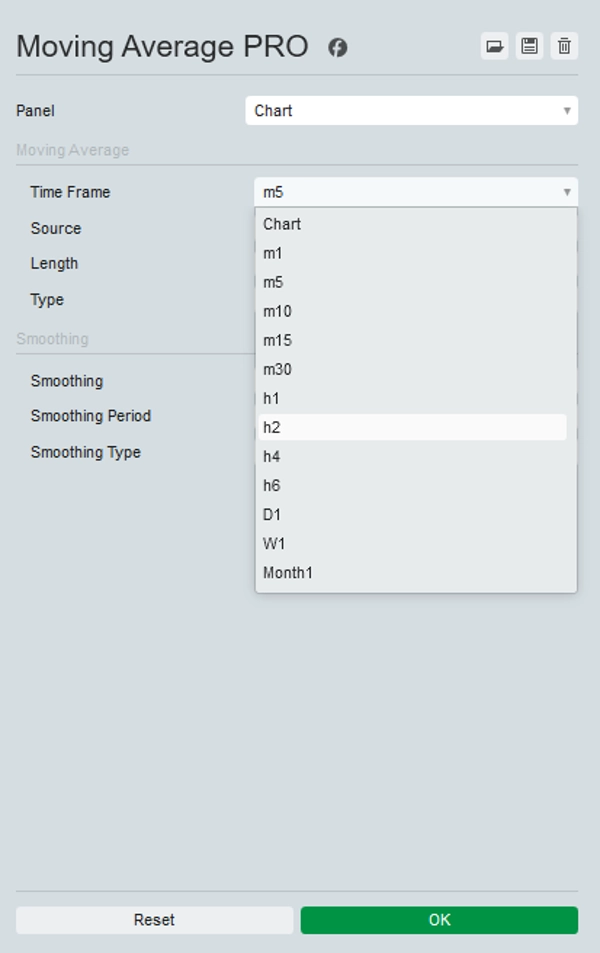
Bu geliştirilmiş versiyon ayrıca daha yüksek zaman dilimi hareketli ortalamalarını tik zaman dilimlerine ve Heikin Ashi'ye destekler. Renko ve Aralık periyotları henüz desteklenmemektedir.
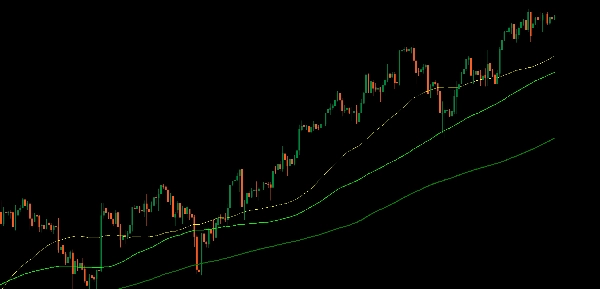
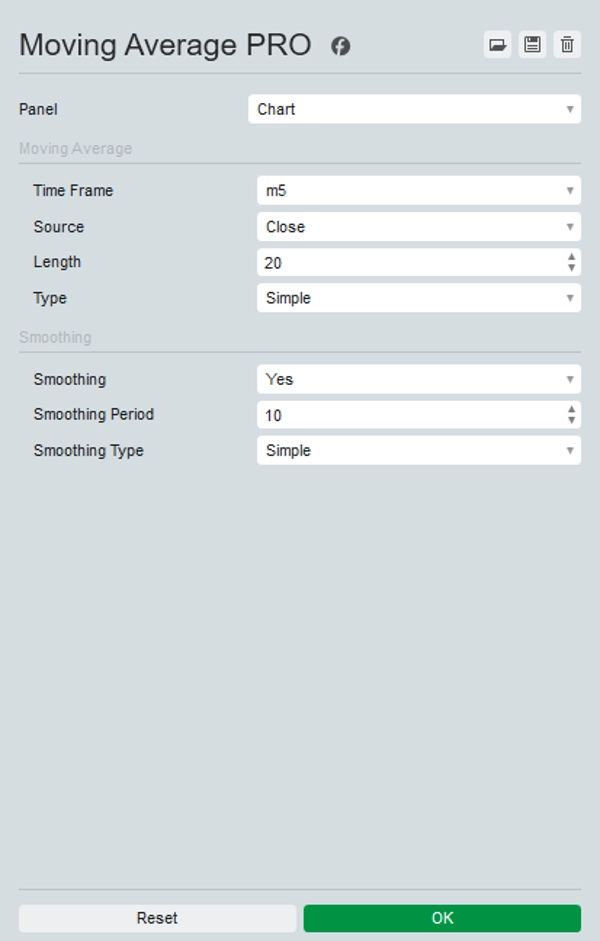
Bu gösterge, örneğin günlük 200 MA'yı herhangi başka bir zaman diliminde görüntülemenizi sağlayarak herhangi bir zaman dilimini seçmenize olanak tanır.
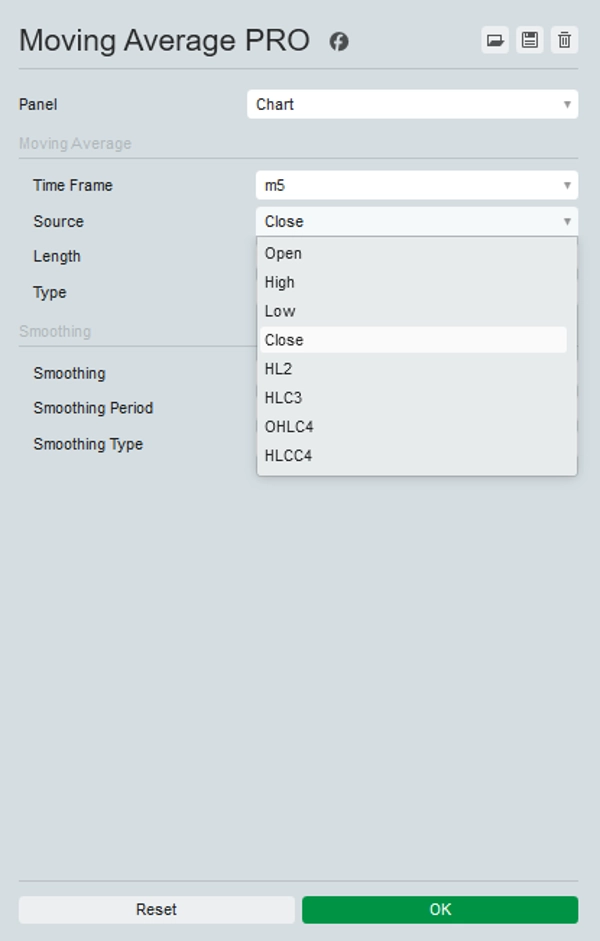
Ayrıca, Açılış, Yüksek, Düşük, Kapanış, HL2, HLC3, OHLC4 ve HLCC4 gibi TradingView'deki gibi seçilebilen çeşitli fiyat kaynakları ve düşük zaman dilimlerinde örnekleme sorunlarını ele almak için isteğe bağlı yumuşatma seçenekleri sunar.
Bu seçenekleri sunarak, Hareketli Ortalama'yı özel ticaret stratejinize uyacak şekilde özelleştirebilir ve piyasa trendleri hakkında daha kesin bilgiler edinebilirsiniz.
Üstün analiz ve karar verme için geliştirilmiş Hareketli Ortalama göstergesi ile ticaret araç setinizi yükseltin.
Özet
Müşteri değerlendirmeleri
5 | 100 % | |
4 | 0 % | |
3 | 0 % | |
2 | 0 % | |
1 | 0 % |