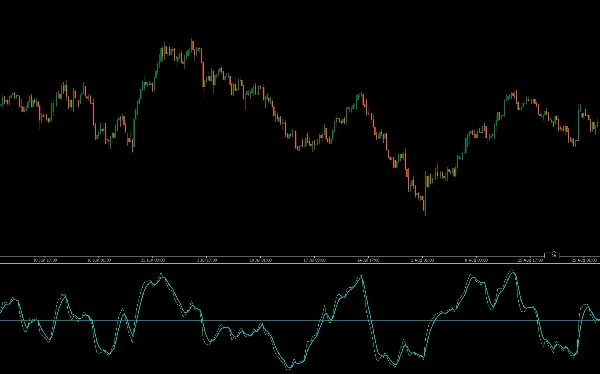
Логотип продукта "TSI True Strength Index"
TSI True Strength Index
Загруженное изображение продукта "TSI True Strength Index"
С 25/09/2025
20
Продажи
178
Бесплатные установки

Introducing the True Strength Index (TSI) indicator, a powerful tool designed to enhance your trading strategy by providing clear insights into market momentum and trend strength.

The TSI indicator measures the underlying strength of price movements, smoothing out market noise to give you a more accurate picture of trend direction. By highlighting overbought and oversold conditions, TSI helps you identify potential reversal points and confirm trend continuations.

TSI uses moving averages of the underlying momentum of a financial instrument. Momentum is considered a leading indicator of price movements, and a moving average characteristically lags behind price. The TSI combines these characteristics to create an indication of price and direction more in sync with market turns than either momentum or moving average.

Perfect for traders seeking to refine their analysis and improve decision-making, the TSI indicator offers a reliable and intuitive way to gauge market dynamics. Upgrade your trading toolkit with the True Strength Index for superior trading performance.

  • Trend identification: A positive TSI indicates a bullish trend, while a negative TSI suggests a bearish trend.
  • Momentum strength: It measures how strongly a trend is moving, with higher values indicating stronger momentum.
  • Potential reversal signals:
    • Crossovers: A signal line crossover near the zero line can signal potential entry and exit points.
    • Divergence: When the price makes a new high or low, but the TSI fails to do so, it can signal a potential trend reversal.
  • Overbought/oversold conditions: It can help identify when an asset may be overbought or oversold, though the specific overbought and oversold levels can vary depending on the asset's volatility. 
Профиль индикатора
0.0
Отзывы: 0
Отзывы покупателей
У этого продукта еще нет отзывов. Уже попробовали его? Поделитесь впечатлениями!
BTCUSD
Forex
Signal
Indices
EURUSD
Commodities
GBPUSD
NZDUSD
Prop
Crypto
Stocks
XAUUSD
NAS100
USDJPY
Продукты, доступные в cTrader Store, включая торговых ботов, индикаторы и плагины, предоставляются сторонними разработчиками и доступны исключительно в информационных и технических целях. cTrader Store не является брокером и не предоставляет инвестиционные консультации, персональные рекомендации или какие-либо гарантии будущей доходности.

Больше от этого автора

Professional execution engine for the Visual Risk Terminal. Instant batch orders, PnL syncing, and automated hedging.
1
Фактор прибыли
0%
Макс. просадка
Логотип продукта "Chandelier Exit"
$ 19
/
$20
Optimize exits with Chandelier Exit! Visualize stop-loss points dynamically for improved trading precision and safety.
Логотип продукта "ATR Bands"
$ 19
Enhance trading with ATR Bands! Visualize market volatility using dynamic upper and lower ATR bands for precise decision
Логотип продукта "MACD Histogram PRO"
$ 19
Enhance MACD Histogram! Visualize bull and bear price changes with vibrant colors for clearer, more insightful trading.
Unlock trading precision with QQE! Dual QQE indicators with a Bollinger Bands zero line provide clear buy/sell signals.
Логотип продукта "Stochastic RSI PRO"
5.0
(1)
$ 28
/
$40
Unlock Stochastic RSI PRO in cTrader! Overlay RSI, highlight zones, and identify divergences with customizable settings.
Логотип продукта "Consolidation Zones"
$ 19
Identify and trade breakouts with Consolidation Zones! Visualize price consolidation areas for trading opportunities.
Visual risk management terminal for cTrader. Set Lot size, SL, and TP via chart lines with real-time PnL projections.
Customize the MACD! Choose colors, get real-time tick updates, and see crossover points for enhanced trading precision.
Customize your Moving Average! Choose any timeframe and price source for precision and flexibility in your analysis.
Visualize trends with Standard Deviation Channel! Display median, and add customizable upper/lower deviation channels.
Advanced MACD & Supertrend bot. Professional trend-following logic with ATR risk management and active profit-taking.
18%
1.82
Фактор прибыли
20.05%
Макс. просадка

Вам также может понравиться

Automatically calculates the previous day’s high and low, determines the range, and then projects Fibonacci levels.
🦅 AI Institutional System: Order Blocks, Volume Delta Profile, OrderFlow Limit Buy/Sell, MTF, psychology & reversal.
Логотип продукта "crossover 1"
$ 19
/
$29
Crossover Buy and Sell Alerts and signals
Логотип продукта "Volume Squeeze Time"
4.5
(2)
Бесплатно
Volume Squeeze, real-time buying and selling.
Shows BUY & SELL signals for 3 & 4 BAR PATTERN (Morning star/ Evening star). It is adjustable and it will SHOW ARROWS.
Liquidity Cluster Order automatically detects and draws accumulation zones & distribution zones
Your Chart in a Strategic Decision Center!
Custom period EMA
Visualize trends with Standard Deviation Channel! Display median, and add customizable upper/lower deviation channels.
ORB Levels PRO – Advanced Opening Range Breakout Tool Master the Market Open with Precision. Europe & US Opening Ranges
Trend Mosaic. Chart Art and Trading Signal Impressions.
Stochastic RSI Indicator
Логотип продукта "session indicator"
$ 20
📈 Trading Sessions Indicator — London, New York & Tokyo Visualize Key Market Sessions + High/Low Levels with Precision
VWAP anchored to swings with real-time alerts. Your pro edge for precise entries/exits.
The Woodie CCI Indicator (Woodie Commodity Channel Index) is a variation of the classic CCI indicator
Adaptive KAMA: fast in trend, slow in noise — with color-coded market state visualization.
Логотип продукта "Swing Levels"
4.0
(2)
Бесплатно
🔍 Automatically detect support and resistance levels based on "swings" or pivots
A powerful overlay tool designed to automatically plot Fibonacci retracement levels based on a custom window.
С 25/09/2025
20
Продажи
178
Бесплатные установки