
설명
cTrader 플랫폼을 위해 특별히 설계된 종합적인 상대 통화 강도(RCS) 지표로 외환 시장 역학에 대한 더 깊은 이해를 열어보세요.
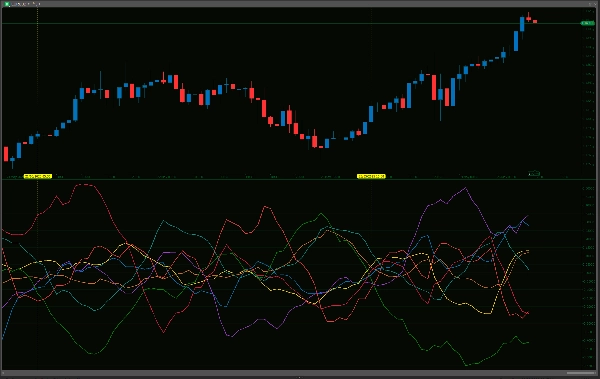
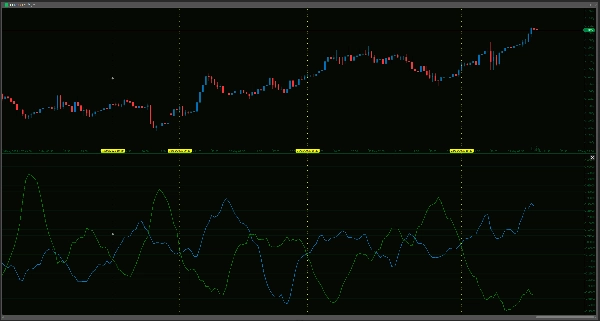
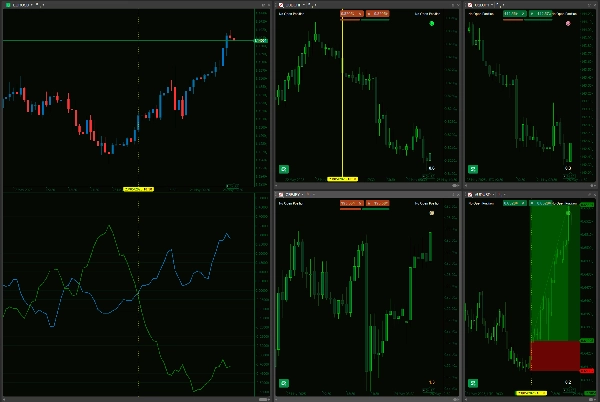
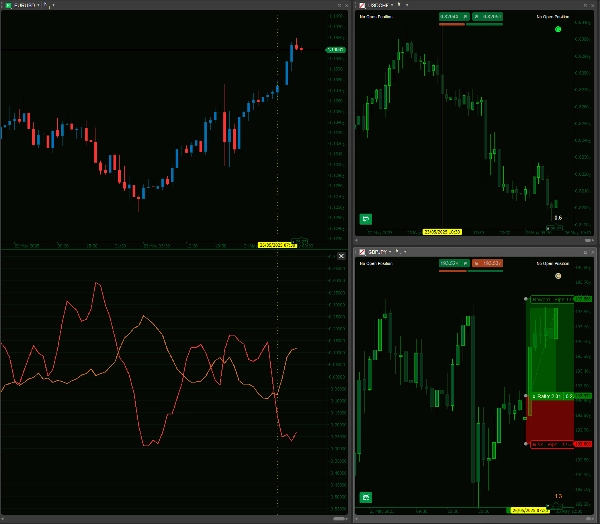
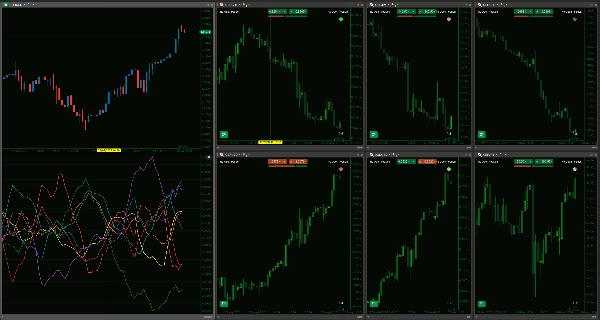
이 강력한 도구는 8개의 주요 통화—AUD, USD, EUR, JPY, GBP, CAD, CHF, NZD—의 개별 성과를 28개의 통화 쌍 바스켓 내에서 서로에 대한 백분율 변화를 분석하여 세밀하게 평가합니다. 사용자가 정의한 조회 기간과 평활 기간을 통해 빠른 스캘핑부터 장기 전략까지 고유한 거래 접근 방식에 맞게 지표의 민감도를 조정할 수 있습니다. 명확한 시각적 출력은 즉각적이고 한눈에 비교할 수 있게 하여 강한 상승 모멘텀을 보이는 통화나 약세 신호를 보이는 통화를 빠르게 식별하는 데 도움을 주며, 이는 전략에 더 높은 잠재력을 가진 통화 쌍을 선택하는 데 중요한 역할을 할 수 있습니다. 단일 쌍 분석을 넘어 개별 통화가 실제로 시장 움직임을 주도하는 큰 그림을 볼 수 있는 방법을 제공합니다.
그러나 이 지표를 사용할 때는 그 기능과 한계를 명확히 이해하는 것이 중요합니다. RCS 지표는 정교한 분석 도구일 뿐, 무오류 예측 장치나 완전한 '설정 후 잊기' 거래 시스템이 아닙니다. 그 계산은 과거 가격 데이터에 기반하며, 기존의 거래 방법론을 보완하기 위한 것이지 대체하기 위한 것이 아닙니다. 거래 방법론에는 항상 철저한 가격 행동 분석, 기본적 요인 고려, 견고한 위험 관리 관행이 포함되어야 합니다. '강도' 또는 '약세'는 선으로 강조되지만, 이러한 판독값은 더 넓은 시장 맥락에서 신중하게 해석되어야 합니다; 예를 들어, 극도의 '강도'를 보이는 통화는 과매수 상태나 주요 저항 수준에 접근하고 있을 수 있습니다.
지표의 성능은 현재 시장 상황에 따라 변동할 수 있으며(예: 강한 추세 시장과 횡보, 변동성 높은 시장에서 다르게 작동할 수 있음), 정확성은 관련된 28개 통화 쌍 모두에 대해 충분하고 깨끗한 과거 데이터가 플랫폼에 존재하는지에 달려 있습니다. 지속적인 계산에 최적화되어 있지만, 이렇게 포괄적인 교차 통화 분석을 위한 초기 데이터 로딩은 특히 느린 연결이나 성능이 낮은 하드웨어에서 플랫폼 자원에 부담을 줄 수 있습니다. 이 RCS 지표는 미묘한 다중 통화 관점을 제공함으로써, 경쟁이 치열한 외환 시장에서 보다 정보에 기반한 전략적이고 건전한 거래 결정을 내리고 잠재적으로 우위를 높이는 데 도움이 되는 귀중한 도구로 제공되며, 단독 솔루션으로서가 아닙니다.
이 지표가 작동하려면 브로커가 이 지표 내 모든 교차 쌍을 제공하는지 확인해 주세요.
--------------------------
다른 지표들도 자유롭게 확인해 보세요!
https://ctrader.com/products/1181
https://ctrader.com/products/1182
https://ctrader.com/products/1180
https://ctrader.com/products/1015
https://ctrader.com/products/555
https://ctrader.com/products/553
https://ctrader.com/products/554
https://ctrader.com/products/552
https://ctrader.com/products/557
https://ctrader.com/products/845
https://ctrader.com/products/848
https://ctrader.com/products/847
https://ctrader.com/products/846
https://ctrader.com/products/551
https://ctrader.com/products/574
https://ctrader.com/products/573
https://ctrader.com/products/556
https://ctrader.com/products/558
https://ctrader.com/products/559
https://ctrader.com/products/560
요약
The indicator provides a clear visual representation of currency strength and weakness, enabling traders to identify currencies with strong momentum or signs of weakness at a glance. This multi-currency perspective helps move beyond single-pair analysis to understand which currencies are driving market movements.
The tool relies on historical price data and requires all relevant currency pairs to be available from the broker. Its performance may vary with market conditions, and it is intended to complement, not replace, comprehensive trading strategies that include price action, fundamental analysis, and risk management. Initial data loading can be resource-intensive due to the breadth of cross-currency calculations.
This indicator serves as an analytical aid to support more informed Forex trading decisions by highlighting relative currency strength across major pairs.
고객 리뷰
5 | 33 % | |
4 | 67 % | |
3 | 0 % | |
2 | 0 % | |
1 | 0 % |


!["[Hamster-Coder] Moving Average MTF" 로고](https://cdn.ctrader.com/image/webp/b11b98b1-194d-4b8e-b00e-d611826ad159_31226)

