
Descripción
📈 PineScriptLabs Smart Signals CDRC [Auto TP/SL]
❓ ¿Qué es este indicador?
El sistema Dynamic Close Range Channels (CDRC) es un indicador desarrollado bajo la teoría de PineScriptLabs que utiliza dos canales independientes para generar señales de compra/venta 📊 y calcular automáticamente objetivos dinámicos de beneficio (TP) y stop loss (SL) 🎯 que nunca son iguales.
🎯 Algoritmo Especial Dinámico de TP/SL ⚡
A diferencia de los sistemas que usan niveles fijos o ATR, este algoritmo calcula TP y SL basados en el movimiento real del precio desde la última señal:
• Para LONG 📈: Mide la distancia desde el precio más bajo registrado hasta la entrada, calcula el porcentaje de ese movimiento, y proyecta ese mismo porcentaje hacia arriba para establecer objetivos
• Para SHORT 📉: Mide la distancia desde el precio más alto registrado hasta la entrada, y proyecta ese porcentaje hacia abajo
🎯 Esto significa que cada operación tiene niveles únicos adaptados al contexto específico del mercado en ese momento, reflejando el impulso real antes de la señal 💡
📊 La Teoría CDRC: Construcción del Canal 🏗️
Fundamento Técnico 🔍
La teoría CDRC construye canales basados exclusivamente en rangos de precios de cierre, no en volatilidad o desviación estándar. Los cierres representan el consenso real del mercado y eliminan el ruido de mechas 🎯
Proceso de Construcción ⚙️
- Precio Promedio: Promedio de todos los cierres del período
- Rango: Diferencia entre el cierre más alto y más bajo del período
- Amplitud: Rango × Multiplicador ÷ 2
- Bandas:
o Superior = Precio Promedio + Amplitud ↗️
o Inferior = Precio Promedio - Amplitud ↘️
🔄 Los canales se recalculan en cada barra, adaptándose constantemente al mercado
⚙️ ¿Cómo funciona?
Dos Canales Simultáneos 📊📊
• Canal 1 (Rápido - 111 barras): Reacciona rápido a los cambios, multiplicador 0.14 ⚡
• Canal 2 (Lento - 388 barras): Visión a largo plazo, multiplicador 0.11 🐢
Generación de Señales 🎯
• LONG ✅: El precio cierra por encima de la banda superior de AMBOS canales durante 2 barras consecutivas 🟢
• SHORT ✅: El precio cierra por debajo de la banda inferior de AMBOS canales durante 2 barras consecutivas 🔴
🛡️ La doble confirmación filtra señales falsas
🤖 Cálculo Automático de TP/SL (Detalle del Algoritmo)
Para LONG 📈:
- El sistema registra continuamente el precio más bajo desde la última señal
- Al generar señal de compra, calcula: Porcentaje = (Entrada - Mínimo) / Entrada × 100
- Proyecta ese porcentaje hacia arriba desde la entrada para establecer TP3
- Divide el rango en tres zonas: TP1 (33%), TP2 (66%), TP3 (100%)
- SL = Entrada - (Entrada × Porcentaje × Ratio de Stop Loss / 100)
Para SHORT 📉:
- El sistema registra continuamente el precio más alto desde la última señal
- Al generar señal de venta, calcula: Porcentaje = (Máximo - Entrada) / Entrada × 100
- Proyecta ese porcentaje hacia abajo desde la entrada para establecer TP3
- Divide el rango en tres zonas progresivas
- SL = Entrada + (Entrada × Porcentaje × Ratio de Stop Loss / 100)
🎯 Resultado: Cada operación tiene niveles únicos calculados según el impulso específico del mercado en ese momento
👀 Visualización 🎨
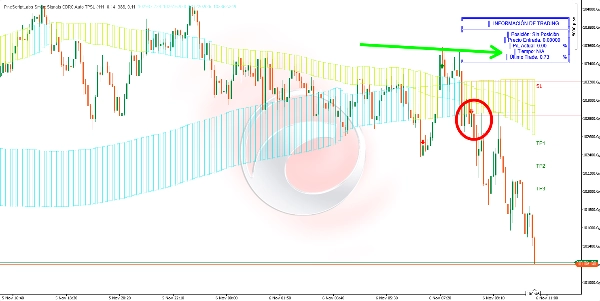
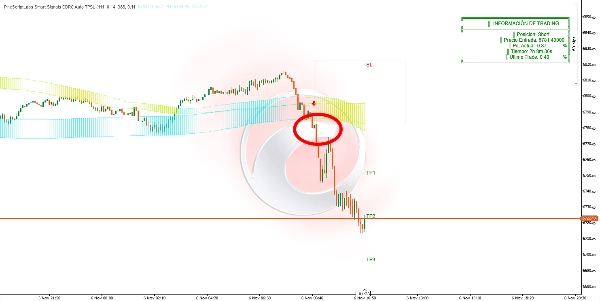
• Puntos: Bandas de ambos canales
• Relleno dinámico: Los canales cambian de color cuando son penetrados
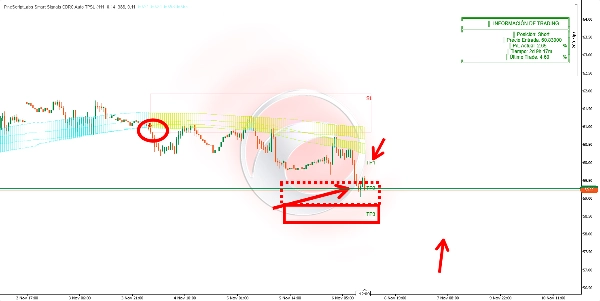
• Cajas: Zona de entrada (SL-Entrada) y tres zonas objetivo (transparencias progresivas)
• Etiquetas: SL, TP1, TP2, TP3 con precios exactos 🏷️
• Flechas: Verde (compra) 🟢 / Rojo (venta) 🔴
• Tabla: Posición actual, precio de entrada, % P/L actual, tiempo en la operación, última operación cerrada 📋
🎯 ¿Para qué sirve?
- Entradas de alta probabilidad con confirmación en doble marco temporal ✅
- Gestión automática de riesgo adaptativa basada en el movimiento real del mercado 🤖
- Objetivos escalonados únicos para cada operación según el impulso previo 🎯
- Adaptación dinámica al comportamiento reciente del precio 🔄
- Monitoreo en tiempo real del rendimiento de la posición 📊
🛠️ ¿Cómo usarlo?
Entrada 🚀: Entrar al cierre de la barra cuando aparece la flecha
Gestión 💼:
• TP1: 33% del movimiento proyectado (beneficios parciales) 💰
• TP2: 66% del movimiento (más beneficios) 💰💰
• TP3: 100% del movimiento (objetivo final) 🎯
• SL: Siempre respetar el stop loss automático ⛔
Monitoreo 👀: La tabla muestra el P/L actual en tiempo real. El sistema detecta automáticamente cuando se alcanza TP3 o SL. Solo una señal activa a la vez ⚠️
⚙️ Parámetros e Impacto
Período del Canal 1 (111):
• ↑ Más barras = Menos señales, más confiable, más lento 🐢
• ↓ Menos barras = Más señales, más rápido, más sensible ⚡
Multiplicador del Canal 1 (0.14):
• ↑ Más alto = Bandas anchas, menos señales, solo movimientos fuertes 💪
• ↓ Más bajo = Bandas estrechas, más señales, mayor sensibilidad 🎯
Período del Canal 2 (388):
• ↑ Más alto = Confirmación estricta, menos señales 🛡️
• ↓ Más bajo = Más señales, menos filtrado 📊
Multiplicador del Canal 2 (0.11):
• ↑ Más alto = Filtrado estricto, conservador 🎯
• ↓ Más bajo = Mayor sensibilidad, más operaciones ⚡
Ratio de Stop Loss (50%):
• 50% = Ratio 1:2 (balance profesional: riesgo 1, beneficio 2) ⚖️
• ↑ Hacia 100% = SL amplio, más riesgo, menos stops, peor R:R 📉
• ↓ Hacia 1% = SL ajustado, menos riesgo, mejor R:R, más stops 📈
🔑 Consideraciones Clave
• Memoria del mercado 🧠: Registra extremos de precio desde la última señal para proyecciones realistas y únicas
• TP/SL nunca iguales ⚖️: Cada operación tiene niveles calculados según su contexto específico
• Confirmación dual obligatoria durante 2 barras consecutivas ✅✅
• Solo una señal activa a la vez ⚠️
• Los canales se recalculan constantemente adaptándose al mercado 🔄
• Las cajas se extienden visualmente para mantener la visibilidad 👀
🚀 Más de 10,000 traders ya usan nuestros mejores indicadores🏆
👉 Obtén todos nuestros sistemas TOP aquí:
_______________________________________________
📌 Indicadores de Estructura de Mercado
· ✅ AdvancedMarket Structure: Bos, Choch, SwinLevels, Order Blocks, Market Structure& Liquidity Finder
· 🔄 Dynamic Market StructureAnalysis of Turning Points
· 🧱 Order Block
· ⚖️ Market Imbalance
· ⛓️ BOS & CHOCH
· 🧠 ICT Power of 3
_______________________________________________
🔚 Sistemas de Salida Inteligente
_______________________________________________
📐 Indicadores ZigZag
· 🔍 ZigZag Price LiquidityProjection
· ➖ ZigZag
_______________________________________________
🧱 Indicadores de Soporte y Resistencia
· 🟩 SmartTrend Support &Resistance Lines
· 🧱 All Support and ResistanceLevels
_______________________________________________
📊 Indicadores de Tendencia y Canal
· 📊 Supertrend
_______________________________________________
💧 Herramientas de Volumen y Liquidez
_______________________________________________
⚡ Indicadores de Momentum y RSI
· 🔎 Multi-Level Candle Bias
Tracker
_______________________________________________
🔮 Herramientas de Predicción y Proyección
· 📐 Predicción basada en Linreg& ATR
· 📏 Regresión Lineal FibonacciMultitemporal
· 📈 Proyector de Flujo de Mercado Potenciado por Volumen
Resumen
Valoraciones de clientes
5 | 67 % | |
4 | 0 % | |
3 | 33 % | |
2 | 0 % | |
1 | 0 % |


