
Deskripsi
Hull Moving Average Colored – Arah Tren Sekilas
Ikhtisar
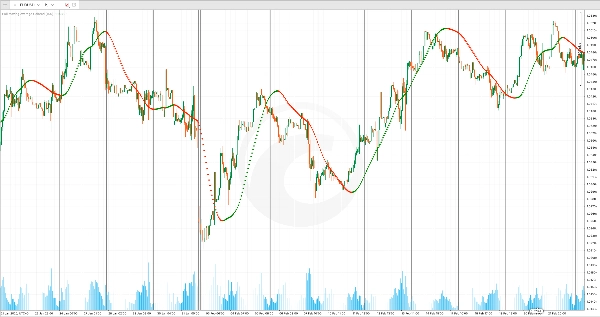
Hull Moving Average Colored adalah indikator pengikut tren yang disederhanakan yang menerapkan responsivitas Hull Moving Average dengan sinyal arah berwarna. Dengan menampilkan tren naik dalam warna hijau dan tren turun dalam warna merah, indikator ini memberikan konfirmasi visual instan tentang arah momentum tanpa memerlukan analisis yang kompleks.
Apa Fungsinya
Dasar Hull Moving Average: Indikator ini menggunakan Hull Moving Average (HMA), sebuah moving average yang bereaksi cepat yang dirancang untuk mengurangi lag sambil mempertahankan kelancaran. Berbeda dengan moving average tradisional, HMA memprioritaskan aksi harga terbaru, membuatnya sangat berguna untuk menangkap perubahan tren lebih awal.
Visualisasi Tren Berkode Warna: Alih-alih satu garis tunggal, indikator ini memplot titik-titik arah:
- Titik Hijau: Muncul saat HMA naik, menunjukkan momentum ke atas
- Titik Merah: Muncul saat HMA turun, menunjukkan momentum ke bawah
Sistem warna biner ini membuat arah tren sangat jelas sekilas—tidak perlu menafsirkan kemiringan atau membandingkan dengan bar sebelumnya.
Fitur Utama
Tampilan Overlay: Indikator ini dipetakan langsung pada grafik harga Anda, memungkinkan Anda melihat arah tren terkait dengan level harga aktual. Ini memudahkan untuk melihat kapan harga menembus di atas atau di bawah moving average, menandakan potensi titik masuk dan keluar.
Pengurangan Lag Responsif: Hull Moving Average bereaksi lebih cepat dibandingkan moving average eksponensial atau sederhana standar, membuatnya sangat efektif untuk trader swing dan intraday yang membutuhkan sinyal tepat waktu tanpa banyak sinyal palsu.
Kustomisasi Sederhana: Sesuaikan parameter Periode untuk mengontrol sensitivitas. Periode yang lebih pendek (misalnya, 20-32) membuat indikator lebih responsif terhadap pergerakan terbaru tetapi rentan terhadap sinyal palsu di pasar yang bergejolak. Periode yang lebih panjang (misalnya, 64-128) memberikan tren yang lebih halus dengan lebih sedikit breakout palsu tetapi mungkin melewatkan pembalikan cepat.
Penggunaan Praktis
Gunakan Hull Moving Average Colored sebagai filter cepat untuk arah perdagangan. Ambil posisi long hanya saat titik hijau muncul dan harga berada di atas rata-rata; ambil posisi short hanya saat titik merah muncul dan harga berada di bawah rata-rata. Sebaliknya, anggap perubahan warna sebagai sinyal keluar potensial—ketika hijau berubah menjadi merah, saatnya menilai kembali posisi long Anda.
Indikator ini bekerja dengan baik di pasar yang sedang tren dan sangat berguna pada timeframe yang lebih tinggi (4 jam dan harian) di mana dapat membantu Anda menyelaraskan dengan bias arah yang lebih luas sebelum melakukan setup pada timeframe yang lebih rendah.
Ringkasan
This indicator overlays directly on price charts and uses a binary color system to indicate trend direction: green points appear when the HMA is rising, signaling upward momentum, and red points appear when the HMA is falling, signaling downward momentum. This visual approach allows traders to quickly identify trend direction without interpreting slopes or comparing previous bars.
Users can adjust the period parameter to control sensitivity—shorter periods increase responsiveness but may generate more false signals, while longer periods smooth trends but may delay signals. The indicator is suitable for various markets including Forex, indices, stocks, and cryptocurrencies such as BTCUSD and XAUUSD. It is particularly useful on higher timeframes (4-hour and daily) for aligning with broader market trends and can assist in identifying potential entry and exit points based on trend changes.
Ulasan pelanggan
5 | 0 % | |
4 | 100 % | |
3 | 0 % | |
2 | 0 % | |
1 | 0 % |


