Penerangan
MFI-MTF: Indeks Aliran Wang Pelbagai Rangka Masa
Gambaran Keseluruhan
MFI-MTF adalah penunjuk momentum pelbagai rangka masa yang membawa perspektif rangka masa lebih tinggi ke carta semasa anda. Dengan mengira Indeks Aliran Wang (MFI) pada rangka masa yang lebih besar dan memaparkannya pada carta kerja anda, penunjuk ini membantu anda mengenal pasti keadaan terlebih beli dan terlebih jual merentasi pelbagai perspektif pasaran tanpa perlu menukar antara rangka masa secara manual.
Apa Yang Dilakukannya
Analisis Indeks Aliran Wang: Penunjuk ini mengukur tekanan pembelian dan penjualan dengan menganalisis pergerakan harga dan volum dagangan. Ia berayun antara 0 dan 100, mengenal pasti bila aset mengalami tekanan pembelian berlebihan (terlebih beli) atau tekanan penjualan berlebihan (terlebih jual).
Konteks Rangka Masa Lebih Tinggi: Daripada mengira MFI pada rangka masa carta semasa anda, MFIMTF menarik data dari rangka masa yang lebih besar yang anda tentukan (harian, mingguan, 4-jam, dan lain-lain). Ini memberi anda pandangan momentum tahap institusi tanpa gangguan dari rangka masa yang lebih rendah. Apabila MFI harian menunjukkan keadaan terlebih beli, contohnya, anda tahu trend yang lebih besar sedang mencapai keletihan—konteks berharga untuk keputusan masuk dan keluar.
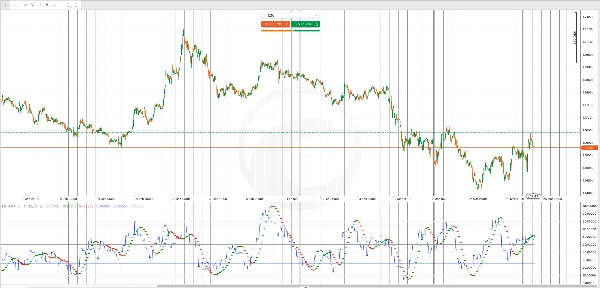
Penapis Purata Pergerakan Hull: Purata Pergerakan Hull (HMA) yang digunakan pada MFI melicinkan ayunan dan menonjolkan perubahan momentum arah. Titik hijau menandakan momentum menaik, manakala titik merah menandakan momentum menurun, memberikan pengesahan visual pantas tentang perubahan arah momentum.
Output Utama
Garis MFI (Biru): Nilai utama Indeks Aliran Wang dari rangka masa lebih tinggi yang anda pilih, dipaparkan pada setiap bar carta semasa anda.
Isyarat HMA (Titik Hijau/Merah): Titik hijau muncul apabila momentum menguat ke atas; titik merah muncul apabila momentum melemah atau berbalik ke bawah. Ini berfungsi sebagai isyarat amaran awal untuk kemungkinan perubahan arah.
Tahap Rujukan:
- Tahap Terlebih Beli (lalai 70): Apabila MFI melebihi ini, tekanan pembelian berlebihan dan pembalikan menjadi mungkin
- Tahap Terlebih Jual (lalai 30): Apabila MFI jatuh di bawah ini, tekanan penjualan telah habis dan pantulan menjadi berkemungkinan
- Garis Tengah (50): Titik keseimbangan neutral antara momentum bullish dan bearish
Penyesuaian
Pemilihan Rangka Masa: Pilih mana-mana rangka masa yang lebih tinggi daripada carta semasa anda (harian pada carta 1-jam, contohnya). Rangka masa yang lebih besar memberikan konteks trend yang lebih luas tetapi isyarat kurang kerap; kenaikan yang lebih kecil menawarkan lebih banyak peluang dagangan tetapi dengan perspektif strategik yang kurang.
Tempoh MFI: Laraskan tempoh tinjauan untuk Indeks Aliran Wang (lalai 14). Tempoh lebih pendek menjadikan penunjuk lebih responsif kepada perubahan volum terkini; tempoh lebih panjang melicinkan turun naik dan mengurangkan isyarat palsu.
Tempoh HMA: Kawal pelicinan penapis momentum. Tempoh lebih pendek menjadikan perubahan trend lebih jelas tetapi lebih bising; tempoh lebih panjang mengesahkan trend dengan lebih boleh dipercayai tetapi dengan penjanaan isyarat yang lebih perlahan.
Ambang Terlebih Beli/Terlalu Jual: Sesuaikan tahap ini mengikut gaya dagangan anda. Pedagang konservatif mungkin menggunakan 75/25; pedagang agresif mungkin menggunakan 80/20 untuk menunggu keadaan yang lebih ekstrem.
Penggunaan Praktikal
Gunakan MFI MTF untuk menambah konfluens kepada kemasukan dan keluar anda. Isyarat jual pada rangka masa kerja anda menjadi lebih boleh dipercayai jika MFI harian sudah terlebih beli, menunjukkan penjual institusi mungkin aktif. Begitu juga, isyarat beli menjadi lebih kuat apabila MFI rangka masa lebih tinggi terlebih jual, menunjukkan tekanan penjualan telah habis pada tahap makro.
Perubahan warna HMA memberi amaran masa nyata tentang perubahan momentum, membantu anda keluar dari dagangan rugi lebih awal atau mengurangkan saiz posisi sebelum pembalikan menjadi teruk.
Ringkasan
The indicator includes a Hull Moving Average (HMA) filter applied to the MFI to smooth out noise and highlight momentum shifts. Green dots indicate strengthening upward momentum, while red dots signal weakening or downward momentum. Reference levels include default overbought (70), oversold (30), and a neutral midpoint (50), all customizable to fit different trading styles.
Key outputs are the MFI line from the chosen higher timeframe and HMA signals for momentum direction changes. Adjustable parameters include the MFI lookback period, HMA smoothing period, and overbought/oversold thresholds. MFI-MTF aids in confirming entry and exit points by providing institutional-level momentum insights and real-time alerts to momentum shifts on your working chart.
Ulasan pelanggan
5 | 100 % | |
4 | 0 % | |
3 | 0 % | |
2 | 0 % | |
1 | 0 % |