![Trading product for [Stellar Strategies] Market Structure Breakout Indikator Signal Breakout, image 1](https://cdn.ctrader.com/image/webp/bceec265-3247-4b11-915f-6295a29c106d_28465)
![Trading product for [Stellar Strategies] Market Structure Breakout Indikator Signal Breakout, image 2](https://cdn.ctrader.com/image/webp/01ab79aa-faea-416f-a7e8-dac2f6195047_28466)
![Trading product for [Stellar Strategies] Market Structure Breakout Indikator Signal Breakout, image 3](https://cdn.ctrader.com/image/webp/3588f2c0-dd5a-4df4-967c-fe2b4de791f8_28467)
![Trading product for [Stellar Strategies] Market Structure Breakout Indikator Signal Breakout, image 4](https://cdn.ctrader.com/image/webp/c098fda7-69e9-4b38-92b0-1561a798b674_28468)
![Trading product for [Stellar Strategies] Market Structure Breakout Indikator Signal Breakout, image 5](https://cdn.ctrader.com/image/webp/4a442b80-f948-483a-bd0a-8ce3767e6b2e_28469)
Penerangan
Penunjuk Pecahan Struktur Pasaran
Gambaran Keseluruhan
Penunjuk ini direka untuk mengenal pasti peluang dagangan berpotensi dengan mengesan pecahan dari julat harga terkini pada carta cTrader anda. Ia menyerlahkan secara visual apabila harga ditutup dengan ketara di atas paras tertinggi terkini (potensi kesinambungan/penukaran bullish) atau di bawah paras terendah terkini (potensi kesinambungan/penukaran bearish), mengambil inspirasi daripada konsep pecahan struktur pasaran.
Cara Ia Berfungsi
- Pengenalpastian Julat: Untuk setiap bar, penunjuk melihat ke belakang sepanjang bilangan bar sebelumnya yang ditetapkan (ditakrifkan oleh
Lookback Period). Ia mengenal pasti harga tertinggi mutlak dan harga terendah mutlak yang dicapai dalam tempoh itu. - Pengesanan Pecahan: Ia memeriksa sama ada harga penutupan bar semasa adalah lebih tinggi daripada paras tertinggi tertinggi yang ditemui dalam tempoh lookback (pecahan bullish) atau lebih rendah daripada paras terendah terendah (pecahan bearish).
- Penapisan Trend (Pilihan): Jika
Enable Trend Filterditetapkan kepadatrue, penunjuk juga memeriksa harga berbanding Purata Pergerakan (Trend MA Period&Trend MA Type). -
- Isyarat pecahan bullish hanya dianggap sah jika harga penutupan juga di atas Purata Pergerakan.
- Isyarat pecahan bearish hanya dianggap sah jika harga penutupan juga di bawah Purata Pergerakan. Ini membantu menapis pecahan yang bertentangan dengan trend semasa yang ditakrifkan oleh MA.
Elemen Visual
- Anak Panah:
-
- Sebuah Anak Panah Bullish (LimeGreen lalai) muncul di bawah rendah bar yang ditutup di atas paras tertinggi terkini (dan memenuhi penapis trend, jika diaktifkan).
- Sebuah Anak Panah Bearish (Merah lalai) muncul di atas tinggi bar yang ditutup di bawah paras terendah terkini (dan memenuhi penapis trend, jika diaktifkan).
- Jarak anak panah dari bar diselaraskan secara automatik berdasarkan volatiliti pasaran menggunakan ATR (
Arrow ATR Offset Multiplier).
- Garis Mendatar:
-
- Apabila berlaku pecahan bullish, sebuah Garis Rintangan Pecah (Merah lalai) dilukis pada paras tertinggi yang telah dipecahkan.
- Apabila berlaku pecahan bearish, sebuah Garis Sokongan Pecah (LimeGreen lalai) dilukis pada paras terendah yang telah dipecahkan.
- Garis-garis ini bermula dari bar di mana pivot tinggi/rendah berlaku dan melanjut ke hadapan melepasi bar pecahan dengan bilangan bar yang ditetapkan oleh
Line Extension Bars. Ini membantu memvisualisasikan paras yang dipecahkan. - Gaya dan ketebalan garis boleh disesuaikan.
- Label (Pilihan):
-
- Jika
Label Typetidak ditetapkan kepadaNone, label teks muncul berhampiran hujung garis mendatar yang dilanjutkan. - Ini boleh memaparkan paras
Pricesebenar,Texttersuai (seperti "MSB"), atauBoth. - Warna label boleh disesuaikan.
- Jika
- Had Sejarah: Hanya bilangan isyarat bullish dan bearish terkini
Max Historical Breakouts(anak panah + garis + label) dipaparkan untuk mengekalkan carta yang kemas. Menetapkan ini kepada 0 memaparkan semua.
Cara Menggunakan & Apa Yang Perlu Diperhatikan
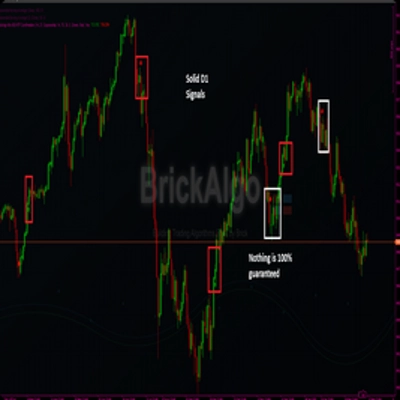
- Isyarat Masuk: Anak panah pecahan boleh menandakan titik masuk berpotensi mengikut arah pecahan. Anak panah bullish mencadangkan kemungkinan masuk panjang, manakala anak panah bearish mencadangkan kemungkinan masuk pendek.
- Pengesahan: Gunakan pecahan bersama bentuk analisis lain (contohnya, analisis volum, corak carta, analisis fundamental) untuk mengesahkan isyarat. Jangan bergantung sepenuhnya pada penunjuk ini.
- Sokongan/Rintangan: Garis mendatar yang dilukis oleh penunjuk mewakili paras harga di mana harga sebelum ini berhenti. Selepas pecahan, paras ini boleh menukar peranan mereka:
-
- Paras rintangan yang dipecahkan (garis merah) mungkin bertindak sebagai sokongan masa depan yang berpotensi.
- Paras sokongan yang dipecahkan (garis hijau) mungkin bertindak sebagai rintangan masa depan yang berpotensi. Perhatikan bagaimana harga berinteraksi dengan garis yang dilanjutkan ini pada bar-bar berikutnya.
- Konteks Trend: Mengaktifkan
Trend Filterboleh membantu anda menumpukan pada pecahan yang selari dengan arah pasaran yang lebih luas, berpotensi mengurangkan dagangan yang bertentangan dengan trend kuat. - Pelarasan Parameter: Cuba dengan
Lookback Period. Tempoh yang lebih pendek akan lebih sensitif dan menghasilkan lebih banyak isyarat (berkemungkinan lebih bising). Tempoh yang lebih panjang akan mengenal pasti pecahan dari julat yang lebih signifikan tetapi menghasilkan isyarat yang lebih sedikit. Laraskan berdasarkan jangka masa dan ciri pasaran. LaraskanTrend MA Perioduntuk menentukan trend yang anda ingin ikuti. - Jangka Masa: Penunjuk berfungsi pada mana-mana jangka masa. Ingat bahawa
Lookback Periodsebanyak 20 bermaksud 20 bar dari jangka masa tertentu itu.
Amaran
- Jika
Enable Sound Alertsadalahtrue, penunjuk akan memainkanAlert Sound Fileyang ditetapkan apabila isyarat pecahan baru muncul pada bar masa nyata terkini (ia tidak akan memberi amaran semasa ujian semula atau pemuatan sejarah).
Parameter Utama
Lookback Period: Bilangan bar lalu untuk mencari tertinggi tertinggi/terendah terendah.Enable Trend Filter: Menghidupkan/mematikan penapis Purata Pergerakan.Trend MA Period/Type: Tetapan untuk Purata Pergerakan penapis trend.Max Historical Breakouts: Mengehadkan berapa banyak isyarat lalu yang dipaparkan.Arrow ATR Offset Multiplier: Mengawal jarak anak panah dari bar berdasarkan volatiliti.Line Extension Bars: Sejauh mana garis mendatar melanjut melepasi pecahan.Label Type/Custom Label Text: Mengawal paparan label pada garis.Enable Sound Alerts/Alert Sound File: Mengkonfigurasi amaran audio.- Parameter Warna/Gaya: Sesuaikan penampilan visual.
Penafian: Dagangan melibatkan risiko. Penunjuk ini menyediakan isyarat teknikal berdasarkan pengiraannya, tetapi ia tidak menjamin keuntungan atau meramalkan masa depan. Sentiasa gunakan pengurusan risiko dan lakukan analisis anda sendiri sebelum membuat sebarang keputusan dagangan.
Ringkasan
Visual cues include lime green bullish arrows below bars breaking above highs and red bearish arrows above bars breaking below lows. These arrows are positioned dynamically based on market volatility using the ATR (Average True Range). The indicator also draws horizontal lines at broken support or resistance levels, extending forward to help visualize these key price levels. Labels can be optionally displayed on these lines, showing price, custom text, or both, with customizable colors.
Users can limit the number of historical breakout signals shown to maintain chart clarity. Sound alerts can be enabled to notify when new breakout signals occur in real time. The indicator works on any timeframe, with sensitivity adjustable via the lookback period and trend filter settings. It is intended to assist in identifying entry points and support/resistance levels but should be used alongside other analysis methods.
Ulasan pelanggan
5 | 100 % | |
4 | 0 % | |
3 | 0 % | |
2 | 0 % | |
1 | 0 % |
![Logo "[Stellar Strategies] BOS Trend 1.0"](https://cdn.ctrader.com/image/webp/6cdec0f1-0e97-4a82-a8a4-2b67aed54d38_25695)
![Logo "[Stellar Strategies] Market Session Ultimate"](https://cdn.ctrader.com/image/webp/61ffd537-0125-4246-9e72-42eca1791d64_28232)
![Logo "[Stellar Strategies] Wave Trend Pro"](https://cdn.ctrader.com/image/webp/5f226fbb-245a-41cd-9cdd-b018257d5e6d_28617)
![Logo "[Stellar Strategies] Inside Bar with Signals"](https://cdn.ctrader.com/image/webp/1d9e8bfa-3b2c-4440-bb37-5856902008a7_30683)
![Logo "[Stellar Strategies] Linear Regression Candles 1.1"](https://cdn.ctrader.com/image/webp/8b9cff9f-2431-46d2-b0ec-c7f55f4a4a6d_27918)
![Logo "[Stellar Strategies] Smart ADX"](https://cdn.ctrader.com/image/webp/af13b084-b6f6-41db-b7bc-c7e688b57b05_36929)
![Logo "[StellarStrategies] Scheduled Trade Executor"](https://cdn.ctrader.com/image/webp/daefc6af-7eca-453e-878d-1b981be2c401_25646)
![Logo "[Stellar Strategies] VBO"](https://cdn.ctrader.com/image/webp/f034c012-94d4-445a-a01b-febd1cdedaef_36944)
![Logo "[Stellar Strategies] SP500 Gap Closure cBot 1.0"](https://cdn.ctrader.com/image/webp/92c23fdc-4ad1-4e61-bdb5-c77f6ec8c539_27686)
![Logo "[Stellar Strategies] Candlestick Patterns Dashboard"](https://cdn.ctrader.com/image/webp/ae8691a5-4884-4553-9bcc-64e16ac82a30_38344)
![Logo "[Stellar Strategies] QQE"](https://cdn.ctrader.com/image/webp/e702104a-874c-4b39-97dd-fb34518d1015_27712)
![Logo "[Stellar Strategies] Visual Trend Momentum"](https://cdn.ctrader.com/image/webp/48aee0a5-f10e-4bc8-9671-78e156fcc5df_27548)