Penerangan
📌 CandleColourFlow_Limited_EURUSD – Versi Demo
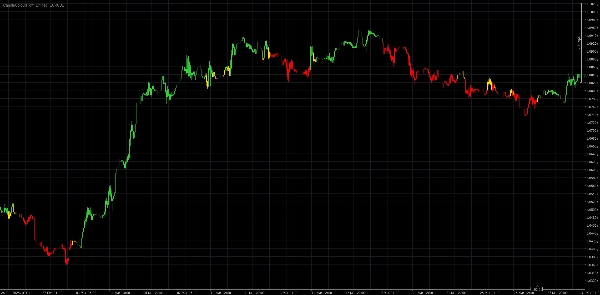
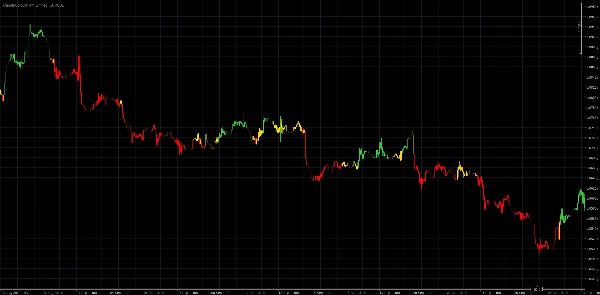
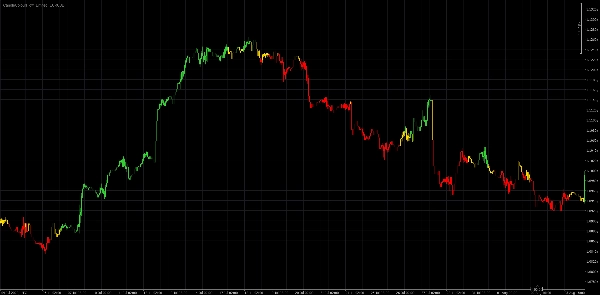
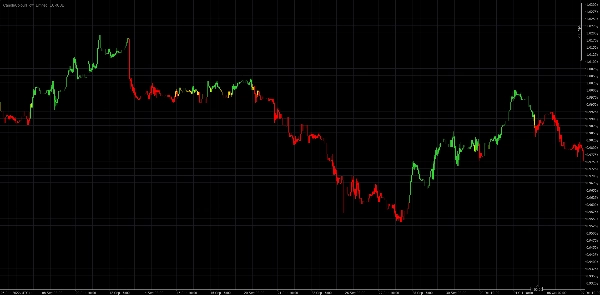
CandleColourFlow adalah penunjuk inovatif yang direka untuk mengenal pasti tren dan titik perubahan pasaran Forex dengan jelas dan pantas. Dengan sistem warna yang mudah dan intuitif, walaupun pedagang pemula boleh membuat keputusan perdagangan yang lebih bermaklumat.
🔹 Lilin hijau – mencadangkan keadaan yang menguntungkan untuk membuka posisi panjang
🔹 Lilin merah – mencadangkan peluang perdagangan pendek yang berpotensi
🔹 Lilin emas – memberi isyarat ketidaktentuan pasaran: potensi pengukuhan atau kesinambungan tren
💡 Apa yang menjadikan CandleColourFlow unik?
- Pandangan visual yang jelas tentang keadaan pasaran tanpa memerlukan pelbagai penunjuk
- Pengesanan automatik perubahan momentum dan perubahan struktur harga
- Sesuai untuk menilai keadaan pasaran secara keseluruhan dengan cepat
⚠️ Penafian Undang-undang:
Penunjuk ini bertujuan untuk tujuan pendidikan sahaja. Ia tidak merupakan nasihat pelaburan atau cadangan untuk melaksanakan sebarang transaksi kewangan.
Mencari lebih banyak?
Versi tambahan CandleColourFlow akan datang tidak lama lagi – setiap satu dengan ciri unik dan sokongan pasaran yang lebih luas.