
Penerangan
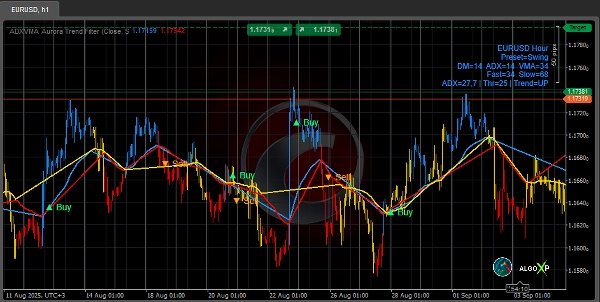
⚡ Penapis Trend Aurora ADXVMA menggabungkan kekuatan trend ADX dengan gabungan EMA adaptif untuk membentuk garis asas perdagangan yang boleh dipercayai. Berbeza dengan indikator biasa yang menggunakan pelicinan tetap, Aurora menyesuaikan secara masa nyata—lebih dekat dengan harga dalam trend kuat, lebih licin dalam julat—dan memaparkan bias Naik / Turun / Neutral yang jelas dengan anak panah silang pilihan. Hasilnya adalah lebih responsif daripada MA statik dan lebih stabil daripada ADX sahaja.
🆚 Kenapa ia lebih kuat daripada indikator biasa
- Berbanding MA tetap: pekali adaptif mengurangkan kelewatan dalam trend dan menapis gangguan dalam julat.
- Berbanding ADX mentah: menukar kekuatan menjadi garis asas yang boleh diperdagangkan (dengan warna & isyarat silang), bukan sekadar nombor.
- Berbanding penapis generik: EMA pantas/lambat berwajaran ADX memberikan campuran keseimbangan sensitiviti dan kestabilan.
🧠 Enjin: Gabungan EMA berwajaran ADX
ADX (0…100) mengukur kekuatan trend. Aurora menggabungkan EMA pantas dan EMA lambat, menggunakan ADX sebagai pemberat:
- ADX tinggi → bias ke arah pantas (kelewatan lebih rendah).
- ADX rendah → bias ke arah lambat (penapisan bunyi lebih baik).
Garis ini berwarna mengikut cerun (dan boleh ditetapkan Neutral apabila ADX lemah), menghasilkan bacaan Biru / Merah / Kuning yang jelas.
🔭 Apa yang ia lakukan
- Garis asas adaptif: menggabungkan EMA pantas & lambat menggunakan ADX sebagai pemberat.
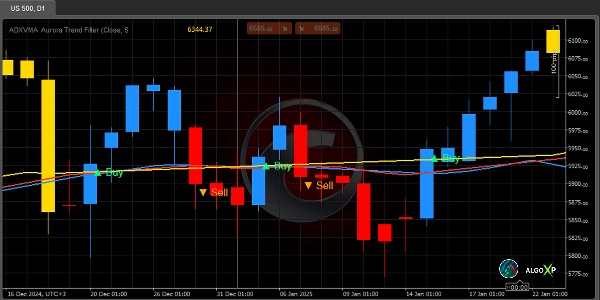
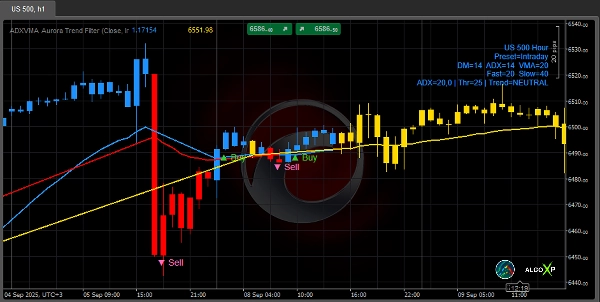
- Warna tiga keadaan: Biru (Naik), Merah (Turun), Kuning (Neutral).
- Bar Warna: pewarnaan lilin untuk konteks segera.
- Anak panah silang: mod Mengikut Trend (Klasik) atau Semua Silang (Ringkas).
- Papan pemuka: tempoh langsung, ADX dan keadaan trend.
- Sedia bot: siri tersembunyi TrendState (−1/0/+1) dan ADX untuk cBots/pemeriksa.
🎯 Cara berdagang
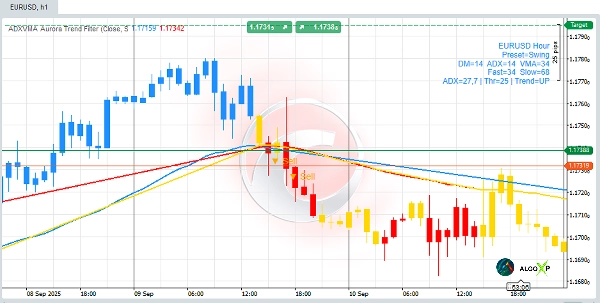
- Bias: Di atas garis + biru → fokus beli; di bawah garis + merah → fokus jual; kuning → berdiri tepi.
- Masuk: ambil anak panah apabila harga melintasi garis asas (pilih Mengikut Trend atau Semua Silang).
- Keluar: berhenti di garis Aurora ± penampan; ambil untung melalui RR≥2 atau pada silang/pertukaran warna bertentangan.
🚀 Tetapan awal (mula cepat)
- Scalp: VMA=12 · ADX=14 · ADX-Thr=28 · NeutralSlope=0.04 · Link=VMA→2×VMA
- Intraday: VMA=20 · ADX=14 · ADX-Thr=25 · NeutralSlope=0.06 · Link=VMA→2×VMA
- Swing: VMA=34 · ADX=14 · ADX-Thr=23 · NeutralSlope=0.10 · Link=VMA→2×VMA
- Posisi: VMA=55 · ADX=14 · ADX-Thr=20 · NeutralSlope=0.15 · Link=VMA→2×VMA
🔧 Parameter utama
- Tempoh DM / ADX / VMA (berasingan, gaya Wilder).
- Gunakan DM asli (Wilder): +DM/−DM ketat (disyorkan Hidup).
- Pautan Adaptif: Paut ke VMA (Pantas=VMA, Lambat≈2×VMA) atau Manual Pantas/Lambat.
- Cerun Neutral (pips): sensitiviti cerun setiap bar.
- Rata jika ADX < Ambang: paksa Neutral semasa trend lemah (Hidup/Mati).
- Anak panah / Bar Warna / Papan Pemuka: hidup/mati; Mod Anak Panah: Mengikut Trend / Semua Silang.
🎯 Sesuai untuk:
- Pedagang scalping, intraday dan swing yang mahukan penapis trend yang jelas + pencetus mudah
- Pedagang algo yang memerlukan siri stabil dan boleh dibaca mesin.
🧭 Petua Masa & Pasaran
- TF rendah (M1–M5): lebih banyak gangguan → mulakan dengan VMA 10–14, NeutralSlope 0.04–0.08, ADX Thr 25–30.
- Intraday (M15–H1): VMA 18–24, NeutralSlope 0.06–0.12, ADX Thr 22–28.
- TF tinggi (H4–D1): VMA 30–60, NeutralSlope 0.10–0.25, ADX Thr 20–25.
- Pasaran utama vs. Volatil (XAU, Crypto): tingkatkan VMA / NeutralSlope / Ambang satu tahap untuk pasaran yang volatil.
Ringkasan
The core mechanism uses ADX (0–100) to weight a fast and slow EMA: high ADX values favor the fast EMA for responsiveness, while low ADX values favor the slow EMA for stability. This approach delivers more responsiveness than static moving averages and greater stability than ADX alone.
Key features include candle color bars for instant trend context, a dashboard showing live periods and trend states, and hidden series outputs (TrendState and ADX) suitable for algorithmic trading and scanners. It supports multiple preset configurations for scalping, intraday, swing, and position trading, with adjustable parameters for trend detection sensitivity and noise filtering.
The indicator is applicable across various markets including Forex, indices, commodities, stocks, and cryptocurrencies, and is designed for use on multiple timeframes from one minute to daily charts. It is suitable for traders seeking a clear trend filter with simple triggers and for algo traders requiring stable, machine-readable signals.
Ulasan pelanggan
5 | 33 % | |
4 | 67 % | |
3 | 0 % | |
2 | 0 % | |
1 | 0 % |


