
Beschreibung
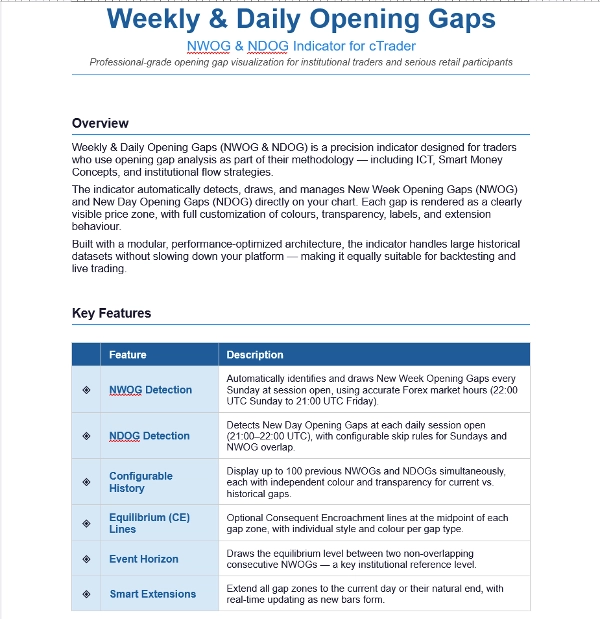
Wöchentliche & tägliche Eröffnungslücken — NWOG & NDOG Indikator
Professionelle Visualisierung von Eröffnungslücken für institutionelle Händler und ernsthafte Privatanleger
ÜBERSICHT
Wöchentliche & tägliche Eröffnungslücken (NWOG & NDOG) sind ein präziser Indikator, der für Händler entwickelt wurde, die die Analyse von Eröffnungslücken als Teil ihrer Methodik verwenden — einschließlich ICT, Smart Money Concepts und institutioneller Flow-Strategien.
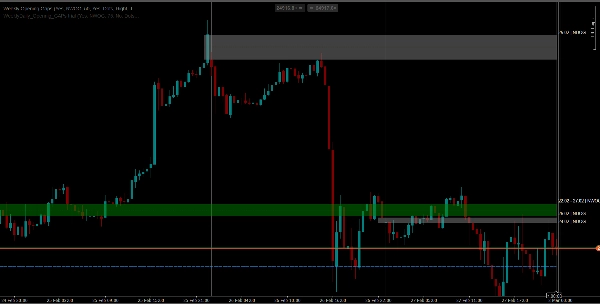
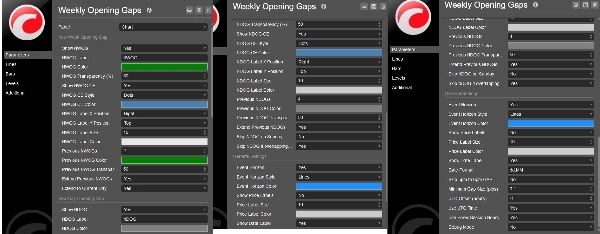
Der Indikator erkennt, zeichnet und verwaltet automatisch New Week Opening Gaps (NWOG) und New Day Opening Gaps (NDOG) direkt in Ihrem Chart. Jede Lücke wird als klar sichtbare Preiszone dargestellt, mit vollständiger Anpassung von Farben, Transparenz, Beschriftungen und Erweiterungsverhalten.
Mit einer modularen, leistungsoptimierten Architektur gebaut, verarbeitet der Indikator große historische Datensätze, ohne Ihre Plattform zu verlangsamen — was ihn gleichermaßen für Backtesting und Live-Trading geeignet macht.
HAUPTMERKMALE
◈ NWOG-Erkennung
◈ NDOG-Erkennung mit konfigurierbaren Überspringregeln für Sonntage und NWOG-Überlappungen.
◈ Konfigurierbare Historie — Anzeige von bis zu 100 vorherigen NWOG
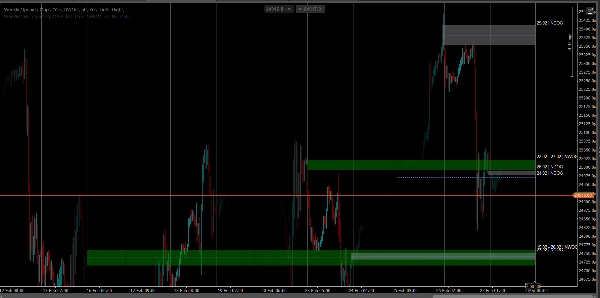
◈ Gleichgewichtslinien (CE)
◈ Ereignishorizont — Zeichnet das Gleichgewichtsniveau zwischen zwei sich nicht überlappenden aufeinanderfolgenden NWOGs
◈ Intelligente Erweiterungen — Verlängert alle Lückenzonen bis zum aktuellen Tag oder deren natürlichem Ende, mit Echtzeit-Aktualisierung beim Entstehen neuer Bars.
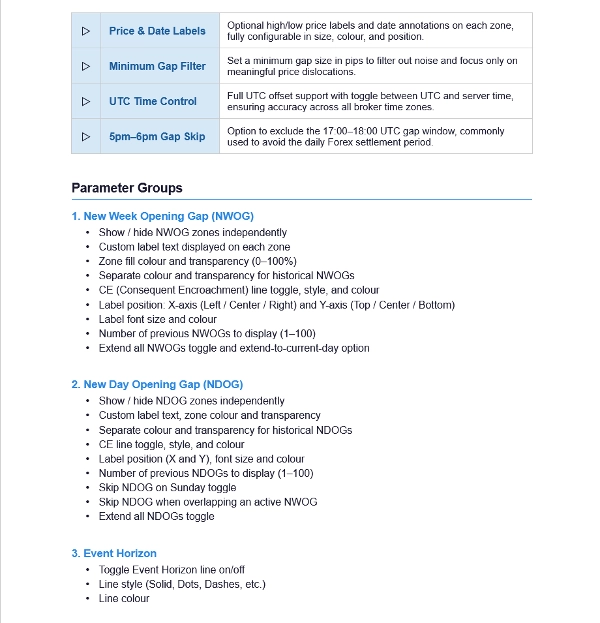
◈ Preis- & Datumsbeschriftungen
◈ Mindestlückenfilter
◈ UTC-Zeitsteuerung
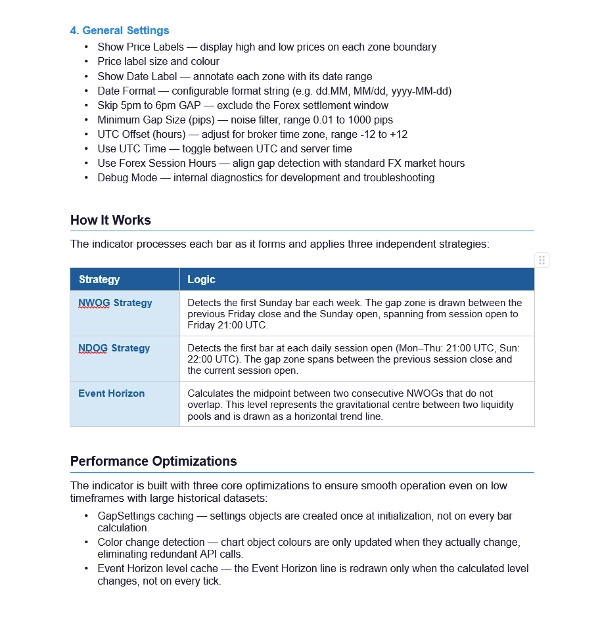
WIE ES FUNKTIONIERT
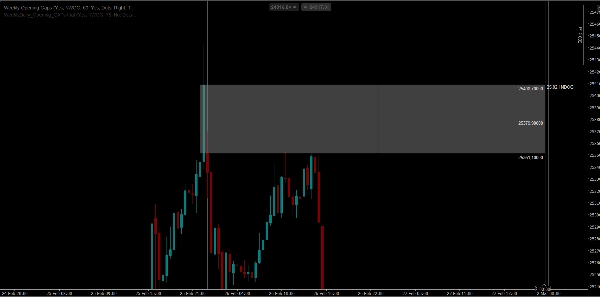
NWOG-Strategie — Erkennt die erste Sonntagskerze jeder Woche. Die Lückenzone wird zwischen dem Schlusskurs des vorherigen Freitags und der Eröffnung am Sonntag gezeichnet, und erstreckt sich von der Sitzungsöffnung bis Freitag 21:00 UTC.
NDOG-Strategie — Erkennt die erste Kerze jeder täglichen Sitzung (Mo–Do: 21:00 UTC, So: 22:00 UTC). Die Lückenzone erstreckt sich zwischen dem Schlusskurs der vorherigen Sitzung und der Eröffnung der aktuellen Sitzung.
Ereignishorizont — Berechnet den Mittelpunkt zwischen zwei aufeinanderfolgenden NWOGs, die sich nicht überlappen. Dieses Niveau repräsentiert das Gravitationszentrum zwischen zwei Liquiditätspools und wird als horizontale Trendlinie dargestellt.
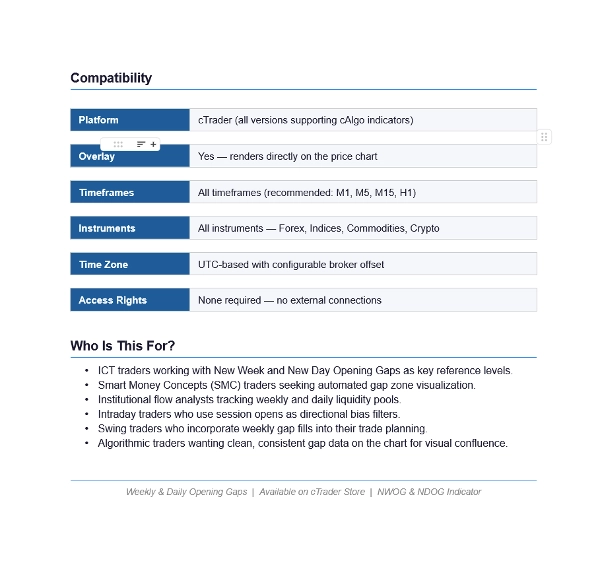
KOMPATIBILITÄT
Plattform: cTrader (alle Versionen, die cAlgo-Indikatoren unterstützen)
Overlay: Ja — wird direkt im Preischart dargestellt
Zeitrahmen: Alle Zeitrahmen (empfohlen: M1, M5, M15, H1)
Instrumente: Alle — Forex, Indizes, Rohstoffe, C
FÜR WEN IST DAS?
ICT-Händler, die mit New Week und New Day Opening Gaps als Schlüsselreferenzniveaus arbeiten
Smart Money Concepts (SMC) Händler, die eine automatisierte Visualisierung von Lückenzonen suchen
Institutionelle Flow-Analysten, die wöchentliche und tägliche Liquiditätspools verfolgen
Intraday-Händler, die Sitzungseröffnungen als Richtungsfilter verwenden
Swing-Trader, die wöchentliche Lückenfüllungen in ihre Handelsplanung einbeziehen
Algorithmische Händler, die saubere, konsistente Lückendaten im Chart für visuelle Übereinstimmung wünschen
Zusammenfassung
Kundenbewertungen
5 | 0 % | |
4 | 100 % | |
3 | 0 % | |
2 | 0 % | |
1 | 0 % |


