
Descrizione
Panoramica
Smetti di indovinare la direzione del mercato. EMA MTF Cloud & Dashboard è un set completo di strumenti per seguire le tendenze, progettato per scalper e day trader. Combina la fluidità delle Medie Mobili Esponenziali con la potenza dell'analisi Multi-Timeframe, tutto in un'interfaccia grafica pulita.
A differenza degli indicatori standard, questo strumento include una logica Smart Neutral Zone per filtrare i mercati instabili, proteggendoti dai falsi segnali durante i periodi di lateralità.
Caratteristiche principali
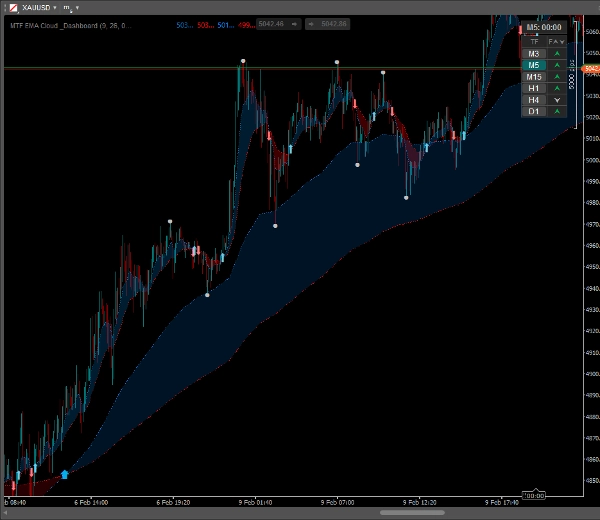
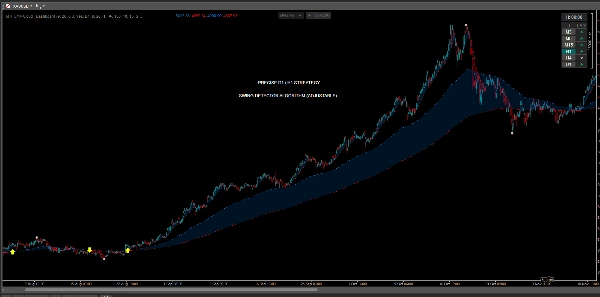
✅ Nuvole EMA Dinamiche
Visualizza immediatamente la tendenza. Lo spazio tra le EMA Veloci e Lente è riempito con una nuvola semi-trasparente, facilitando l'identificazione della forza della tendenza e delle potenziali zone di supporto/resistenza.
✅ Sovrapposizione MTF (Multi-Timeframe)
Vedi il "quadro generale" senza cambiare grafici. Mostra le EMA di timeframe superiori (es. H1) direttamente sul tuo grafico a timeframe inferiore (es. M5).
- Include frecce separate per i crossover della tendenza MTF!
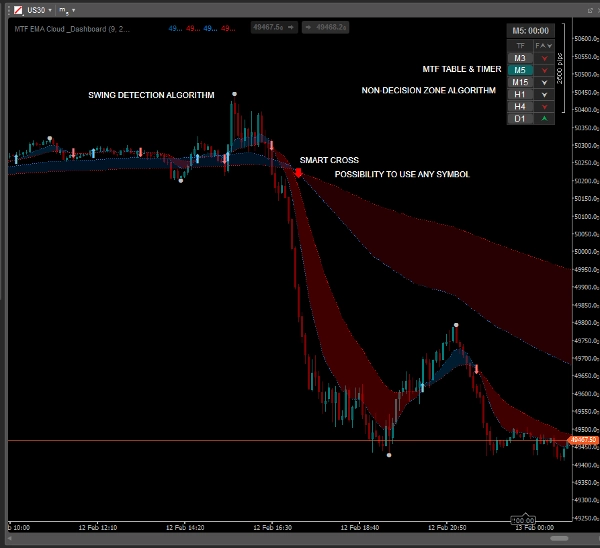
✅ Dashboard Smart Trend
Una tabella compatta e cliccabile che mostra lo stato della tendenza per 6 timeframe (da M3 a Daily).
- Logica Neutral Zone: La dashboard rileva i mercati laterali (consolidamento) e li evidenzia in grigio/argento, aiutandoti a evitare operazioni sfavorevoli.
- Interattiva: Clicca su qualsiasi pulsante del Timeframe nella tabella per cambiare immediatamente il grafico.
✅ Punti Swing High / Swing Low
Segna automaticamente i massimi e minimi locali significativi. Perfetto per posizionare Stop Loss o identificare i livelli di Take Profit basati sulla struttura recente dei prezzi.
✅ Segnali di Crossover Visivi
Frecce chiare e personalizzabili appaiono esattamente quando l'EMA Veloce incrocia l'EMA Lenta.
- Personalizza colori, dimensioni e stili delle frecce.
✅ Timer della Candela
Un timer integrato mostra esattamente quanto tempo manca alla chiusura della candela, essenziale per temporizzare le tue entrate.
Come Fare Trading (Esempio di Strategia)
- Controlla la Dashboard: Assicurati che i timeframe superiori (es. H1, H4) siano allineati (Verde/Rosso). Evita di fare trading se mostrano "Neutro" (Grigio).
- Aspetta il Segnale: Cerca una freccia di crossover nella direzione della tendenza principale.
- Conferma con l'Azione del Prezzo: Usa i punti "Swing High/Low" per confermare la struttura del mercato.
- Entra e Gestisci: Entra alla chiusura della candela. Usa la Nuvola EMA come supporto dinamico per spostare il tuo stop loss.
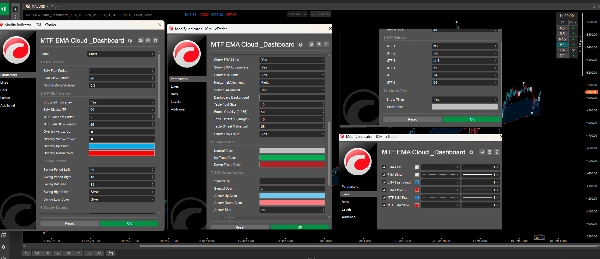
Personalizzazione
L'indicatore è altamente personalizzabile per adattarsi al tuo stile:
- Regola i periodi EMA sia per la modalità corrente che per quella MTF.
- Cambia i colori per Nuvole, Frecce, Swing e la Dashboard.
- Configura la posizione e la trasparenza della Dashboard.
- Attiva o disattiva qualsiasi funzione in modo indipendente.
Riepilogo
A smart dashboard displays trend status across six timeframes (from 3 minutes to daily), incorporating a neutral zone logic that highlights flat or consolidating markets to help avoid false signals. The dashboard is interactive, enabling quick chart switching by clicking on timeframe buttons. The tool automatically marks swing high and low points to assist in setting stop loss and take profit levels based on recent price structure. Visual crossover arrows signal EMA fast and slow line crossovers, with customizable colors and styles. Additionally, a candle timer shows the remaining time until the current candle closes, aiding precise trade timing.
The indicator is highly customizable, allowing adjustments to EMA periods, colors, dashboard position, transparency, and feature toggling to fit individual trading styles. It supports markets including Forex, Crypto, and commodities like gold (XAUUSD), and is tagged for use with symbols such as BTCUSD and USDJPY.
Recensioni dei clienti
5 | 0 % | |
4 | 100 % | |
3 | 0 % | |
2 | 0 % | |
1 | 0 % |


