
Descrizione
HCCC MTF - Hurst Cycle Composite Channel (100% GRATUITO)
Panoramica
Il HCCC MTF (Hurst Cycle Composite Channel) è un avanzato indicatore interattivo Multi-Timeframe (MTF) e dashboard. Basato sulle teorie cicliche di J.M. Hurst combinate con la volatilità ATR, questo strumento ti aiuta a identificare la vera tendenza di mercato e i perfetti punti di svolta ciclici (picchi e valli) su più timeframe simultaneamente.
Il secondo dedicato al trading semi-automatico con https://ctrader.com/products/3618?u=cLogic
IMPORTANTE: Questo indicatore è completamente 100% GRATUITO per tutti. È stato specificamente sviluppato come il compagno visivo definitivo per il cBot "Follow The Trend XAU Edition".
Sebbene possa essere utilizzato perfettamente per il trading manuale, il suo vero potenziale si sblocca quando usato in una configurazione semi-automatica: usi la dashboard HCCC per leggere il ciclo e il momentum dei timeframe superiori, quindi abiliti il cBot Follow The Trend XAU Edition per eseguire e gestire con precisione le operazioni in quella direzione.
Caratteristiche principali
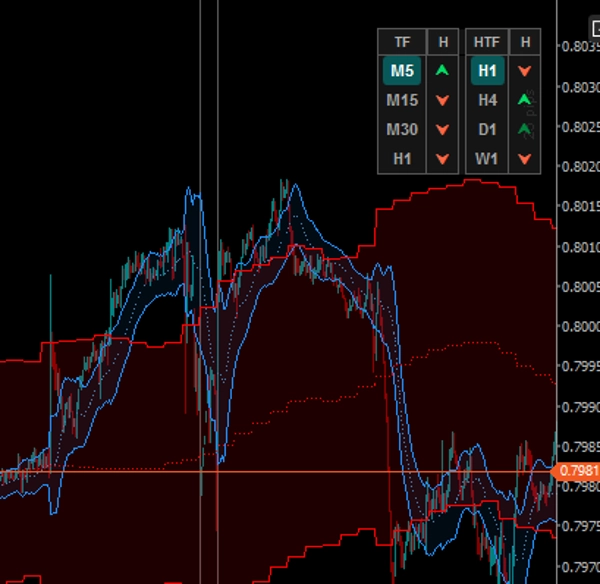
1. Dashboard MTF Interattiva (Cliccabile)
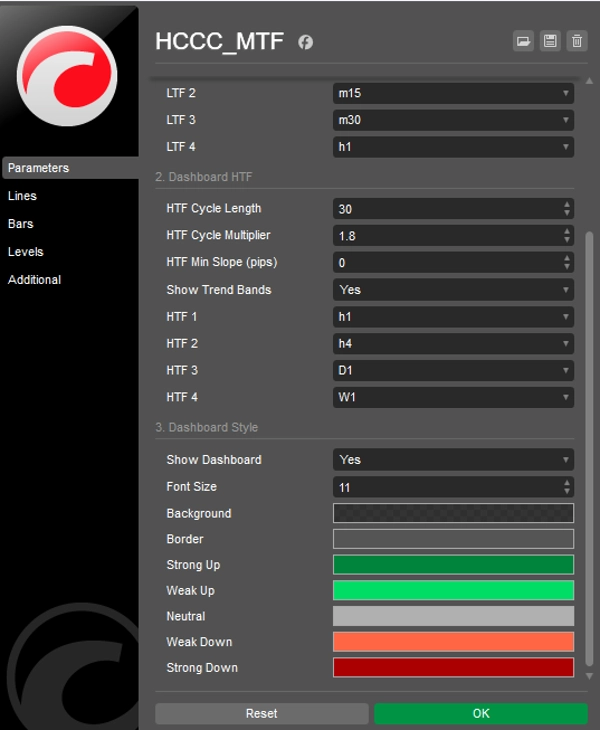
Dimentica di dover passare continuamente da un grafico all'altro. La dashboard sul grafico traccia 4 Timeframe Inferiori (LTF) e 4 Timeframe Superiori (HTF).
- Pulsanti LTF: Clicca qualsiasi pulsante LTF per cambiare istantaneamente il timeframe del grafico corrente.
- Pulsanti HTF: Clicca qualsiasi pulsante HTF per proiettare istantaneamente il canale di quel Timeframe Superiore direttamente sul grafico corrente!
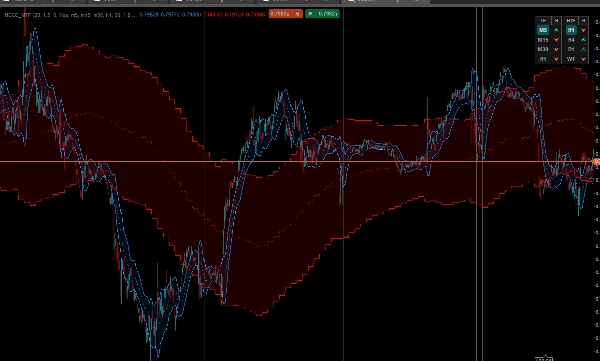
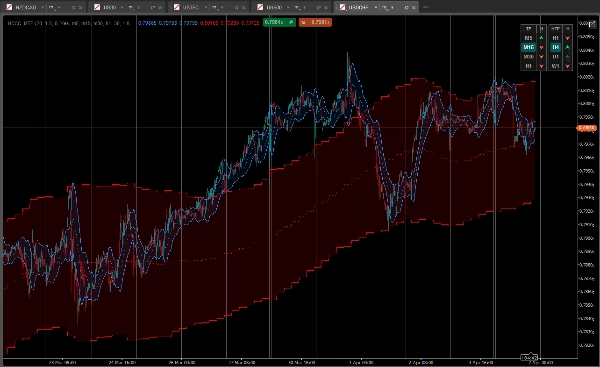
2. Sistema di Sovrapposizione a Doppio Canale
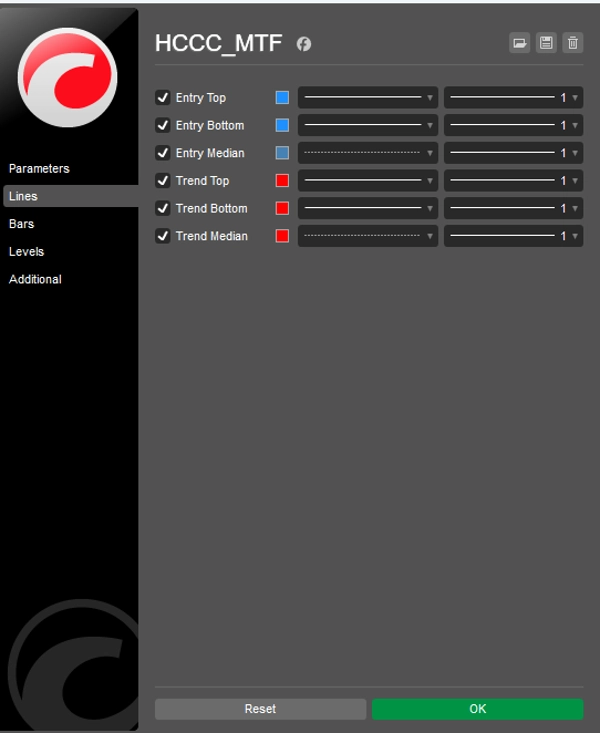
L'indicatore traccia due eleganti canali riempiti di nuvole sul tuo grafico contemporaneamente:
- Ciclo di Entrata (Nuvola Blu): Calcola il ciclo di Hurst basato sul timeframe del grafico corrente.
- Ciclo di Tendenza (Nuvola Rossa): Un canale a visione macro calcolato dal Timeframe Superiore selezionato nella dashboard.
3. Segnali Ciclici Avanzati a 5 Stati
La dashboard non mostra solo la direzione della tendenza; mostra la fase del ciclo analizzando la pendenza della linea mediana e la posizione del prezzo rispetto alle bande ATR.
- [ ⮝ ] Verde Scuro (Acquisto Forte): La pendenza mediana è IN SALITA, e il prezzo è sceso fino alla banda inferiore. Questo è un minimo ciclico (compra al ribasso).
- [ ⮝ ] Verde Chiaro (Acquisto Debole): La tendenza è IN SALITA, ma il prezzo si aggira intorno alla mediana o alla banda superiore.
- [ — ] Grigio (Neutro): Il ciclo è piatto. Nessun momentum chiaro.
- [ ⮟ ] Rosso Chiaro (Vendita Debole): La tendenza è IN DISCESA, ma il prezzo è vicino alla mediana.
- [ ⮟ ] Rosso Scuro (Vendita Forte): La pendenza mediana è IN DISCESA, e il prezzo è salito fino alla banda superiore. Questo è un picco ciclico (vendi al rialzo).
Come usarlo con il cBot "Follow The Trend XAU Edition"?
- Guarda il lato destro della dashboard (Colonna HTF). Aspetta un allineamento chiaro sui Timeframe Superiori (es. H4 e D1 che mostrano frecce verdi scure/chiare).
- Guarda il lato sinistro della dashboard (Colonna LTF) per trovare un pullback localizzato (es. M15 che mostra una freccia verde scuro "Acquisto Forte").
- Una volta che la logica MTF si allinea, attiva il tuo cBot Follow The Trend XAU Edition nella direzione "BUY" e lascia che i suoi algoritmi gestiscano l'entrata, gli stop mobili e la gestione del rischio.
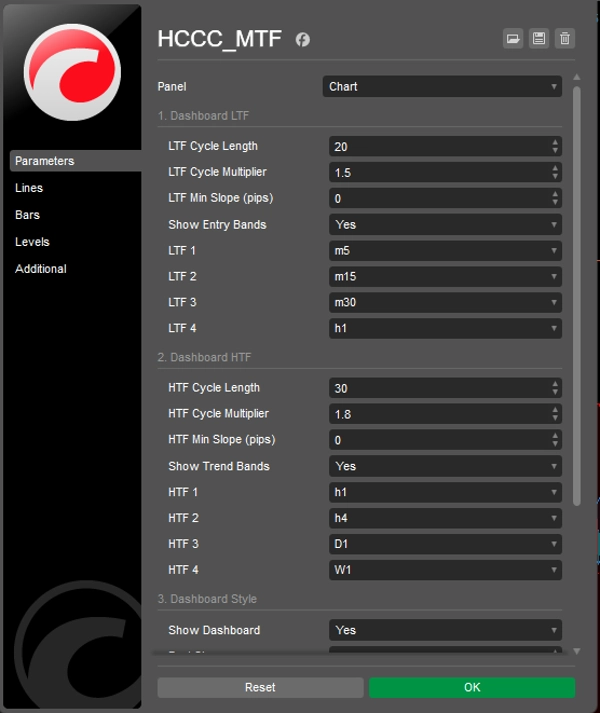
Personalizzazione
Tutto è completamente personalizzabile: lunghezze del ciclo, moltiplicatori ATR, sensibilità minima della pendenza (in pips) per filtrare il rumore, e pieno controllo sui colori e il posizionamento dell'interfaccia utente.
Scaricalo ora GRATIS e porta il tuo trading semi-automatico al livello successivo!
Riepilogo
It overlays two cloud-filled channels: a blue "Entry Cycle" channel based on the current timeframe and a red "Trend Cycle" channel derived from a selected higher timeframe. The dashboard provides advanced five-state cyclic signals indicating strong or weak buy/sell conditions and neutral phases by analyzing the slope of the median line and price position relative to ATR bands.
The indicator is fully customizable, including cycle lengths, ATR multipliers, slope sensitivity, and UI appearance. It is intended to complement the "Follow The Trend XAU Edition" cBot by providing visual cycle and momentum analysis to guide semi-automated trade execution and management. The HCCC MTF supports various markets including Forex, commodities, indices, stocks, and cryptocurrencies.


